CUET Preparation Today
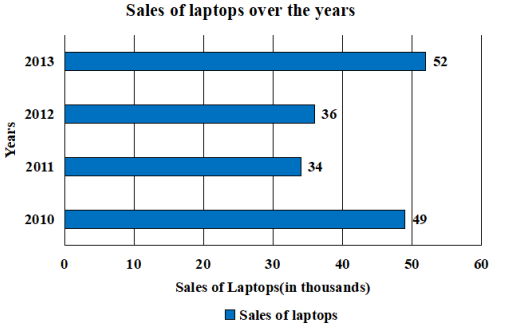
Study the following bar-chart and answer the question that follows. The bar-chart shows the sales of laptops (in thousands) over a period of four years.
Find the percentage increase in sales from 2012 to 2013 giving your answer correct to two places of decimal. |
42.98% 48.54% 45.64% 44.44% |
44.44% |
Percentage increase in sale from 2012 to 2013 = \(\frac{52 - 36 }{36}\) × 100 = \(\frac{ 16 }{36}\) × 100 = 44.44% |