CUET Preparation Today
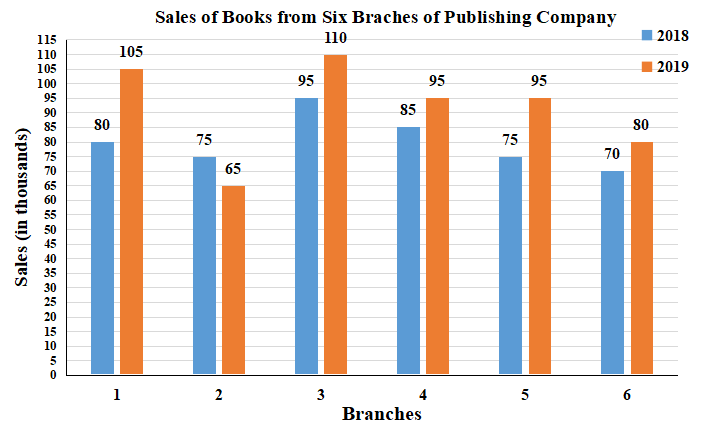
The following bar graph shows the sales of books (in thousands) from six branches of a publishing company during two consecutive years 2018 and 2019 .
What is the ratio of the total sales of the second branch for both years to the total sales of the fourth branch for both years? |
4 : 3 5 : 9 8 : 11 7 : 9 |
7 : 9 |
Ratio of the total sales of the second branch for both years to the total sales of the fourth branch for both years, = ( 75 + 65 ) : ( 85 + 95 ) = 140 : 180 = 7 : 9 |