CUET Preparation Today
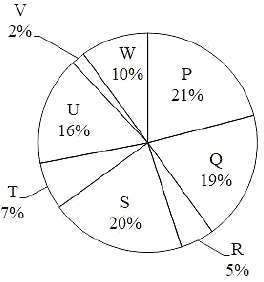
The pie chart given below shows the number of bike sold by 8 different companies. The total number of bike sold by all these 8 companies are 2000. Number of bikes sold by a particular company is shown as a percent of total number of bike sold by all these 8 companies.
What is the difference between the average number of bikes sold by P, Q, R and S and the average number of bikes sold by T, U, V and W? |
150 200 175 125 |
150 |
Total sale of company P , Q , R & S = ( 21% + 19% + 5% + 20% ) of 2000 = 65% of 2000 = \(\frac{13}{20}\) × 2000 = 1300 Average sale of company P , Q , R & S = \(\frac{1300}{4}\) = 325 Now , Total sale of company T , U , V & W = ( 7% + 16% + 2% + 10% ) of 2000 = 35% of 2000 = \(\frac{7}{20}\) × 2000 = 700 Average sale of company T , U , V & W = \(\frac{700}{4}\) = 175 Required difference = 325 - 175 = 150 |