CUET Preparation Today
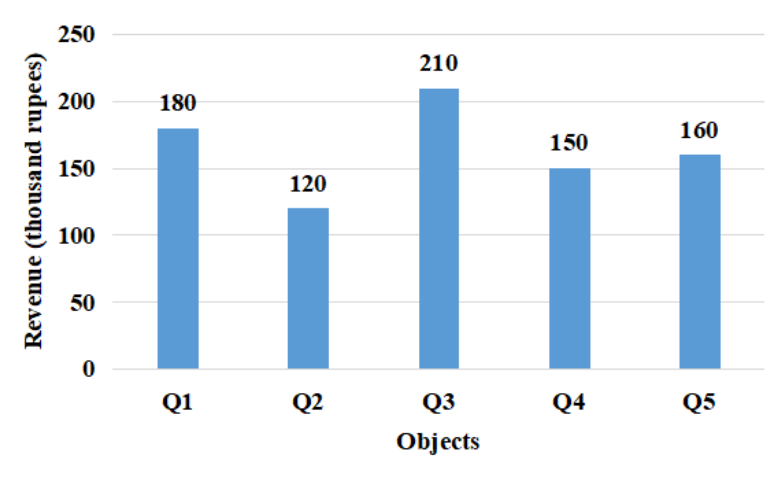
The following bar chart shows the revenue (in thousand rupees) generated from the sale of 5 different objects, Q1 to Q5.
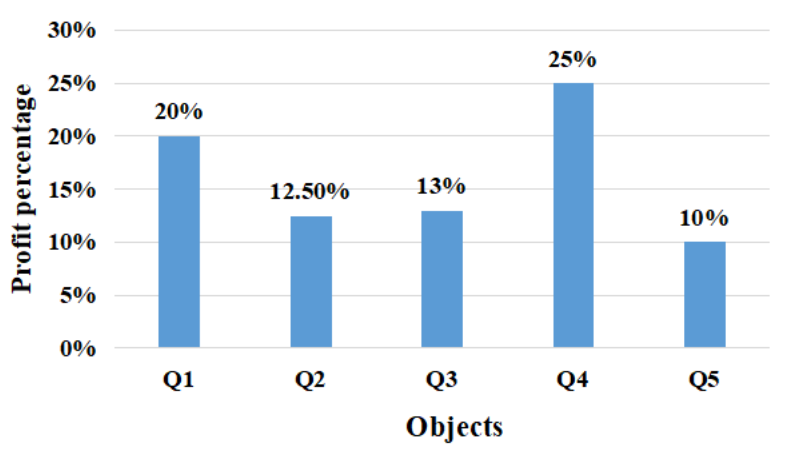
The following bar chart shows the profit percentage gained through the sales of these 5 objects.
Profit percentage = $\frac{Revenue − Cost}{Cost}$ × 100 |
₹1,40,000 ₹1,20,000 ₹1,50,000 ₹1,60,000 |
₹1,50,000 |
Profit percentage = $\frac{Revenue − Cost}{Cost}$ × 100 Revenue of Q1 = 180 Profit of Q1 = 20% 20% = $\frac{180000 − Cost}{Cost}$ × 100 0.2 = $\frac{180000 }{Cost}$ - 1 1.2 = $\frac{180000 }{Cost}$ Cost = $\frac{180000 }{1.2}$ = 150000 |