CUET Preparation Today
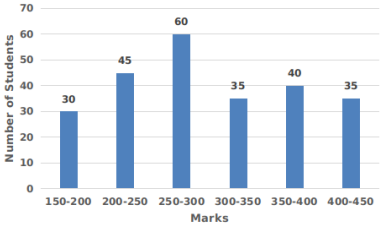
Study the given histogram that shows the marks obtained by students in an examination and answer the question that follows.
If the total marks obtained by students be represented as a pie chart, then the central angle of the sector representing marks 200 or more but less than 300, is: (correct to the nearest degree) |
128° 154° 68° 88° |
154° |
Total number of students = 30 + 45 + 60 + 35 + 40 + 35 = 245 Central angle corresponds to students having marks 200 or more but less than 300 = \(\frac{ 45 + 60 }{245}\) × 360° = \(\frac{ 105 }{245}\) × 360° = 154.28° = 154° (correct to the nearest degree) |