CUET Preparation Today
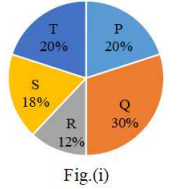
Study the given pie charts and answer the question that follows. The pie charts represent the distribution of candidates who were enrolled for Bank Clerical Examination Fig (i) and the candidates(out of those enrolled) who passed the examination Fig(ii) in five different institutes P, Q, R, S and T. (I) Total number of candidates enrolled in five different institutes = 5500
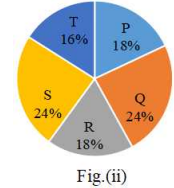
(I) Total number of candidates who passed the examination from five institutes = 3300
The percentage of the candidates who passed to the number of candidates enrolled for institutes P and T together is: |
54% 51% 50% 52% |
51% |
Number of students enrolled in P & T = \(\frac{20+20 }{100}\) × 5500 = \(\frac{2 }{5}\) × 5500 = 2200 Number of students passed in P & T = \(\frac{16+18 }{100}\) × 3300 = \(\frac{34 }{100}\) × 3300 = 1122 Required percentage = \(\frac{1122 }{2200}\) × 100 = \(\frac{1122 }{22}\) = 51% |