CUET Preparation Today
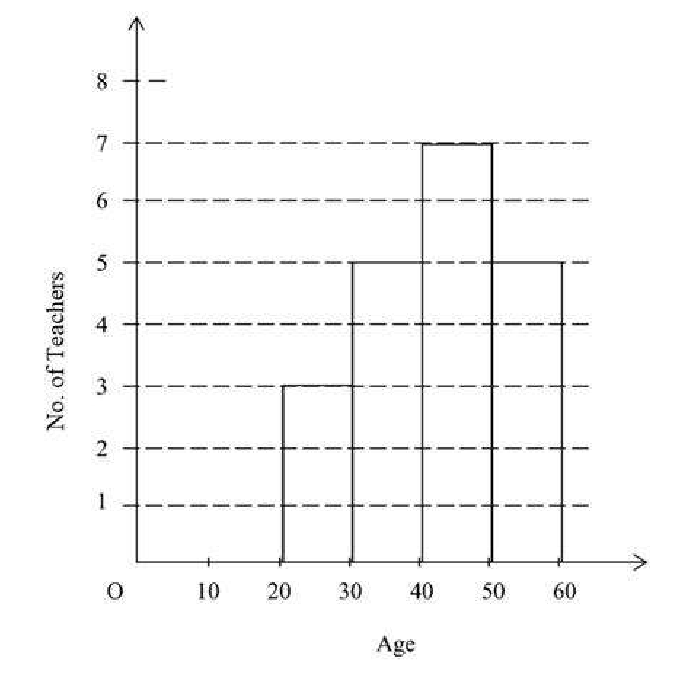
Passage: The adjoining Histogram shows frequency distribution of ages of 20 teachers in a school. Based on Historgram choose correct option for question no 70-72.
|
No. of teachers in age group 20 to 40 is |
20 5 8 15 |
8 |
No. of teachers in age group 20-30 = 3 No. of teachers in age group 30-40 = 5 Therefore, No. of teachers in age group 20-40 = 3 + 5 = 8 |