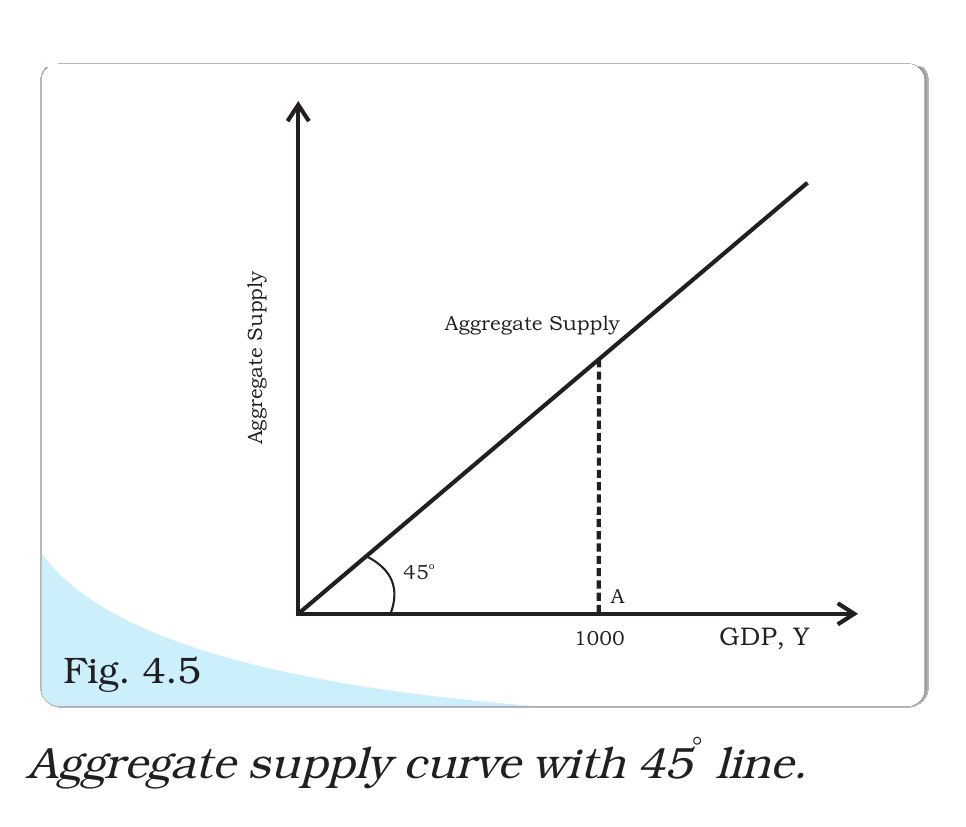
Which of the following curves is graphically depicted by a 45° line passing through the origin ?
Answer & explanation
Correct answer: option 3
The correct answer is Option (3) → Aggregate supply curve
In the simple model with fixed prices, unused resources are available. So firms supply whatever level of output is demanded, and the amount supplied at an output Y is Y itself.
Every point on a 45° line through the origin has the same horizontal and vertical values. With output on the horizontal axis, this line shows that much supplied on the vertical axis. So it is the aggregate supply curve.
Option (1) Consumption curve — Incorrect. Consumption is a fixed amount that does not depend on income (autonomous consumption) plus cY, where c is the marginal propensity to consume. The curve starts above the origin, and its slope c is less than 1.
Option (2) Investment curve — Incorrect. Investment is taken as autonomous, the same at every level of income. So the investment curve is a horizontal line.
Option (3) Aggregate supply curve — Correct. Supply equals output at every point, so it is the 45° line.
Option (4) Aggregate Demand curve — Incorrect. Aggregate demand is consumption plus investment. It starts above the origin at autonomous spending and rises with slope c. Equilibrium is where it cuts the 45° line.
NCERT (2026-27): “Supply Side of Macroeconomic Equilibrium In microeconomic theory, we show the supply curve on a diagram with price on the vertical axis and quantity supplied on horizontal axis. In the first stage of macroeconomic theory, we are taking the price level as fixed. Here, aggregate supply or the GDP is assumed to smoothly move up or down since they are unused resources of all types available. Whatever is the level of GDP, that much will be supplied and price level has no role to play. This kind of supply situation is shown by a 45° line. Now, the 45° line has the feature that every point on it has the same horizontal and vertical coordinates.”
|