CUET Preparation Today
Study the given graph and answer the question that follows.
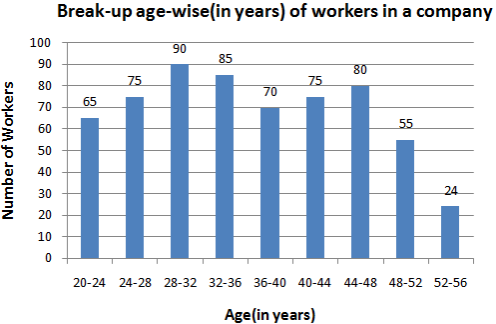
The number of workers whose age is 32 years or more but less than 44 years is: |
220 215 225 230 |
230 |
Number of workers whose age is 32 years or more but less than 44 years = 85 + 70 + 75 = 230 |