CUET Preparation Today
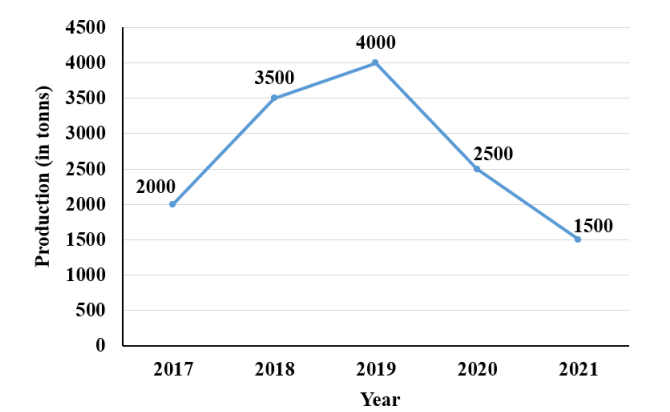
In the following graph the production of rice in 5 consecutive years are plotted. In which year the production of rice is maximum?
|
2017 2018 2020 2019 |
2019 |
By observing the graph carefully . We find that maximum production of rice is 4000 tons in year 2019. |