CUET Preparation Today
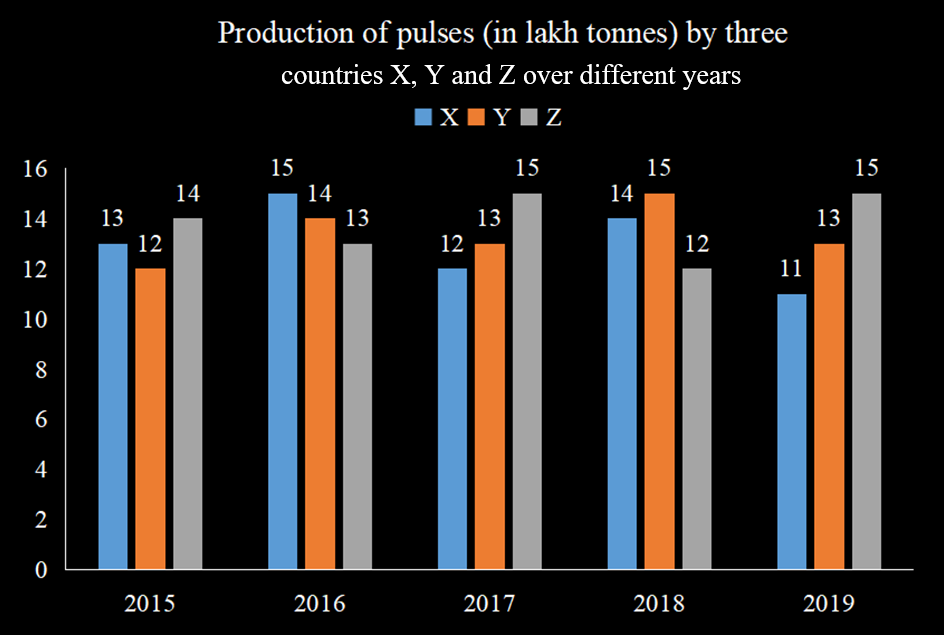
The given bar graph shows the data of production of pulses (in lakh tonnes) by three different countries X, Y and Z over the years. Study the bar graph and answer the question that follows.
For which country is the average production (in lakh tonnes) for five years the maximum? |
X Z Y Y and Z both |
Z |
Average production of company X = \(\frac{13 + 15 + 12 + 14 + 11}{5}\) = 13 lakh tonnes Average production of company Y = \(\frac{12 + 14 + 13 + 15 + 13}{5}\) = 13.4 lakh tonnes Average production of company Z = \(\frac{14 + 13 + 15 + 12 + 15}{5}\) = 13.8 lakh tonnes So , company Z has highest average production . |