CUET Preparation Today
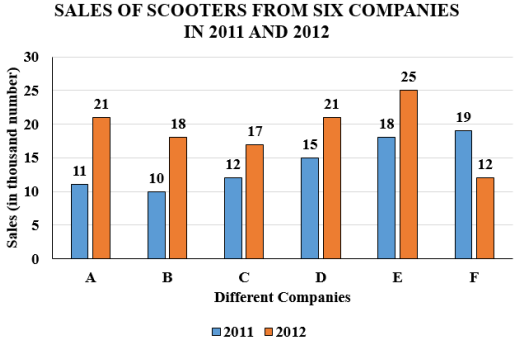
The following bar graph shows the sales (in thousand numbers) of scooters from six different companies in 2011 and 2012.
The average sales of companies A and E in 2011 are what percentage of the average sales of companies B and D in 2012 ? |
65.89% 72.87% 70.89% 74.36% |
74.36% |
Average sale of B & D in 2012 = \(\frac{18 + 21 }{2}\) = 19.5 Average sale of A & E in 2011 = \(\frac{11 + 18 }{2}\) = 14.5 Required percentage = \(\frac{14.5}{19.5}\) × 100 = 74.36% |