CUET Preparation Today
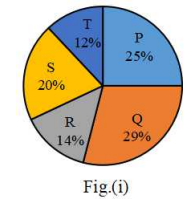
The given pie charts show the distribution of students of graduate and postgraduate levels in five different institutes, P, Q, R, S and T, in a town. Study the pie charts and answer the question that follows. (i) Total number of students of graduate level in five different institutes = 12400
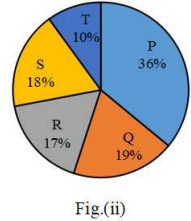
(ii) Total number of students of postgraduate level in five different institutes = 8000
The total number of graduate and post graduate level students in institute Q is: |
5216 5126 5116 4116 |
5116 |
Total number of graduate and post graduate students in Q = \(\frac{29 }{100}\) × 12400 + \(\frac{19 }{100}\) × 8000 = 3596 + 1520 = 5116 |