
Passage:
The adjoining histogram shows the frequency distribution of the ages of 20 teachers in a school. Based on the histogram, choose the correct option for each question.
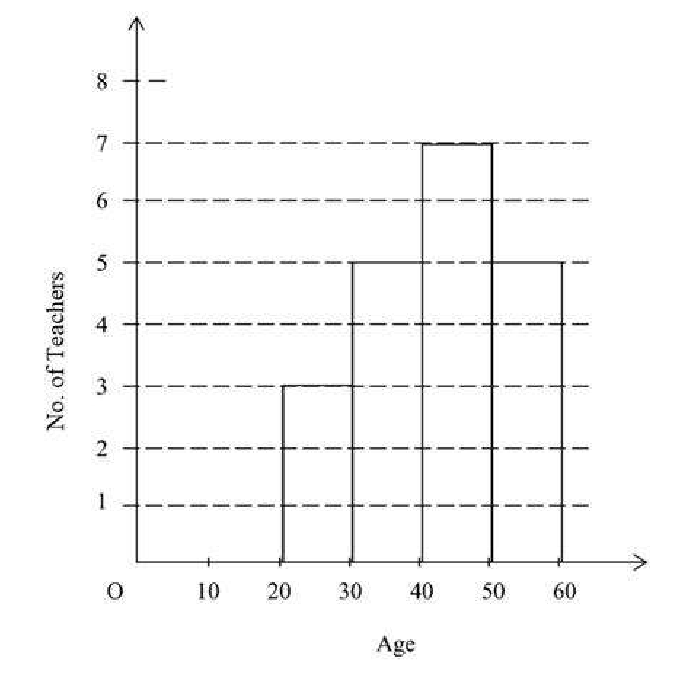
By how many is the number of teachers of age group 40-50 more than the number of teachers of age group 20-30?
Answer & explanation
Correct answer: option 3
The correct answer is Option (3) → 4
In a histogram, the height of each bar is the frequency of its class, read off the vertical axis.
Age group 40-50: the bar reaches 7, so 7 teachers
Age group 20-30: the bar reaches 3, so 3 teachers
Difference \(=7-3=4\)