
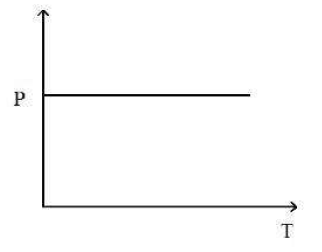
The graph between resistivity and temperature given below can be for the material
Answer & explanation
Correct answer: option 3
The correct answer is Option (3) → Manganin
The resistivity of a material changes with temperature as \( \rho_T = \rho_0\,[1 + \alpha\,(T - T_0)] \), where \( \alpha \) is the temperature coefficient of resistivity. The graph is a horizontal line, so the resistivity does not change with temperature: the material must have \( \alpha \approx 0 \).
Option (1) Copper — Incorrect. Copper is a metal with a fairly large positive \( \alpha \) (about \( 4\times10^{-3}\,\mathrm{K^{-1}} \)), so its resistivity rises steadily with temperature.
Option (2) Nichrome — Incorrect. Nichrome has a small but positive \( \alpha \) (about \( 1.7\times10^{-4}\,\mathrm{K^{-1}} \)), so its resistivity still rises with temperature, though slowly.
Option (3) Manganin — Correct. Manganin has a temperature coefficient of only about \( 2\times10^{-6}\,\mathrm{K^{-1}} \), so its resistivity is almost independent of temperature; this is why it is used for standard resistors.
Option (4) Semiconductors — Incorrect. In a semiconductor the number of charge carriers grows with temperature, so its resistivity falls as the temperature rises.
NCERT (2026-27):
Temperature Dependence of Resistivity – “… Some materials like Nichrome (which is an alloy of nickel, iron and chromium) exhibit a very weak dependence of resistivity with temperature (Fig. 3.9). Manganin and constantan have similar properties. These materials are thus widely used in wire bound standard resistors since their resistance values would change very little with temperatures.”