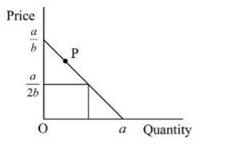
The given diagram indicates a linear demand curve, State the elasticity of demand at point 'P' as shown in the diagram.
Answer & explanation
Correct answer: option 4
The correct answer is Option (4) → eD > 1
Point P lies above the midpoint of the straight-line demand curve, so demand at P is elastic.
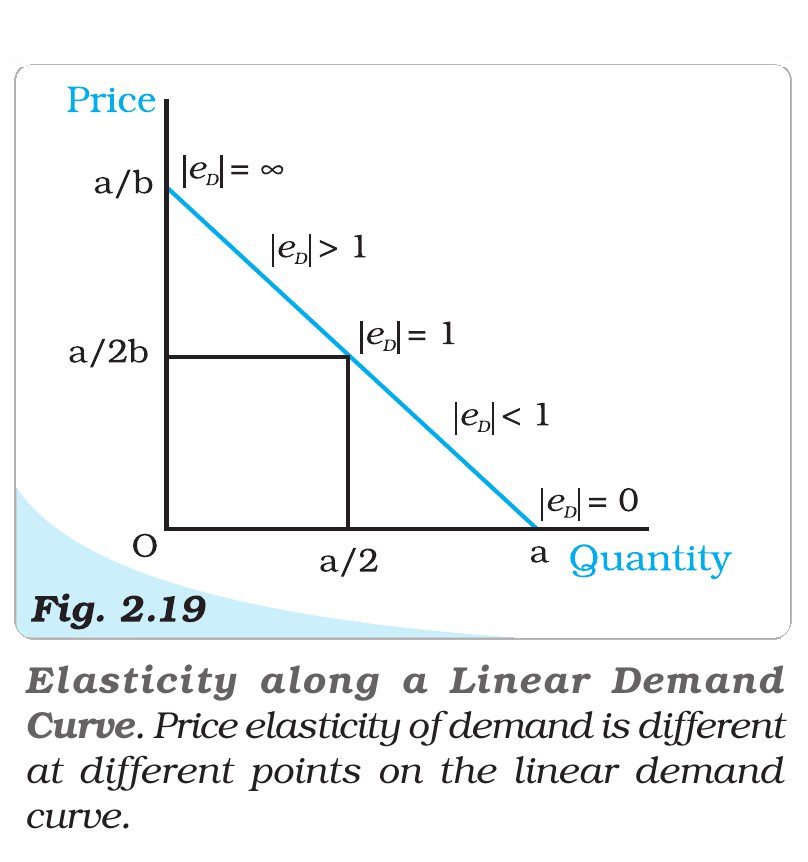
On a linear demand curve the price elasticity of demand (eD) is different at every point:
At the midpoint, where price is a/2b, eD = 1.
At any point above the midpoint, towards the price axis, eD > 1.
At any point below the midpoint, towards the quantity axis, eD < 1.
Where the curve meets the quantity axis, eD = 0; where it meets the price axis, it is infinite.
In the diagram, P is marked at a price higher than a/2b.
NCERT (2026-27): “2.6.1 Elasticity along a Linear Demand Curve …From (2.17), it is clear that the elasticity of demand is different at different points on a linear demand curve.… Geometric Measure of Elasticity along a Linear Demand Curve …The elasticity of demand at different points on a straight line demand curve can be derived by this method. Elasticity is 0 at the point where the demand curve meets the horizontal axis and it is ∞ at the point where the demand curve meets the vertical axis. At the midpoint of the demand curve, the elasticity is 1, at any point to the left of the midpoint, it is greater than 1 and at any point to the right, it is less than 1.…”
|