CUET Preparation Today
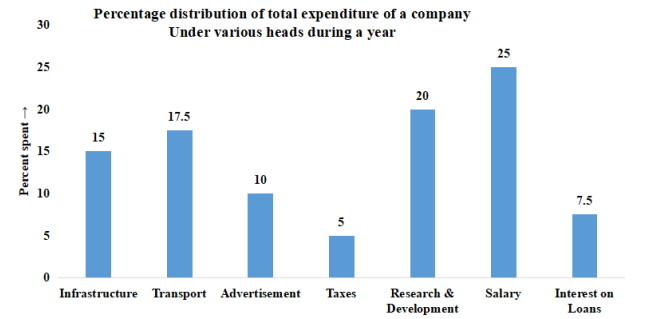
Study the given graph and answer the question that follows. The bar graph shows the percentage distribution of total expenditure of a company under various expense heads during a year.
The total expenditure of the company in the year is how many times the expenditure on Research & Development? |
5 4 6 7 |
5 |
Total expenditure of company = 15 + 17.5 + 10 + 5 + 20 + 25 + 7.5 = 100 Expenditure on Research & Development = 20 Expenditure on Research & Development is what times of Total expenditure = \(\frac{100 }{20}\) = 5 |