CUET Preparation Today
Which of the following is not the graphical representation of first-order kinetics? |
|
|
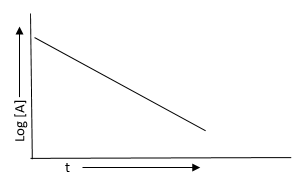
The correct answer is option 4. We know, for a first order reaction, \(k = \frac{2.303}{t}log\frac{[A]_0}{[A]}\) or, \(k = \frac{k}{2.303}t = log\frac{[A]_0}{[A]} = log[A]_0 - log[A]\) or, \(log[A] = -\frac{k}{2.303}t + log[A]_0\) This is the equation of the straight line \((y = mx + c)\). Thus, if \(log[A]\) or \(log(a - x)\) values are plotted against time, \(t\), the graph obtained should be a straight line if the reaction is of the first order.
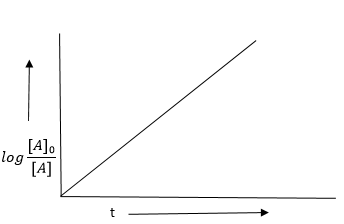
The intercept made on the y-axis would be ‘\(log[A]_0\)’ and the slope of the line would be equal to \(-\left(\frac{k}{2.303}\right)\), i.e., \(\text{slope = }-\left(\frac{k}{2.303}\right)\) . Further, we can also write \(log\frac{[A]_0}{[A]} = \frac{k}{2.303}t\) Thus if we plot \(log \frac{[A]_0}{[A]}\) versus\(t\), a straight line graph will be obtained with \(\text{slope = }\frac{k}{2.303}\)
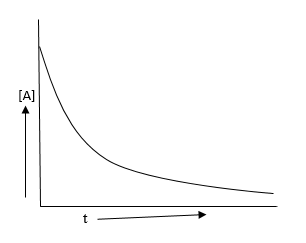
The concentration time graph can also be plotted as
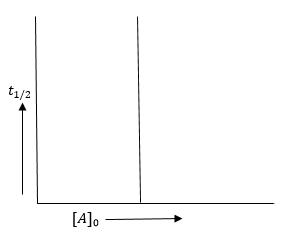
Thus the graphs for the first order reaction is option 1, 2 and 3.Hence, the only graph which does not belong to first order reaction is option 4. |