CUET Preparation Today
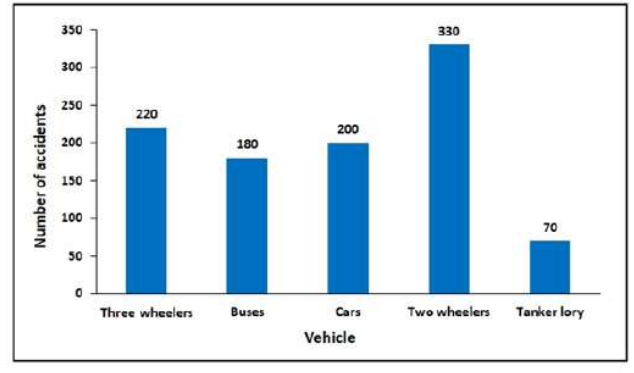
The following bar graph shows the number of accidents that happened in a city during the year 2021. B = difference in accidents of two wheelers and buses. B is what percent of total number of accidents?
|
33% 15% 18% 10% |
15% |
According to the bar graph, Number of accidents in two wheelers = 330 Number of accidents in buses = 180 Their difference = 150 Total number of accidents in 2021 = 220 + 180 + 200 + 330 + 70 = 1000 Required percentage = $\frac{150}{1000}$ x 100 = 15% |