CUET Preparation Today
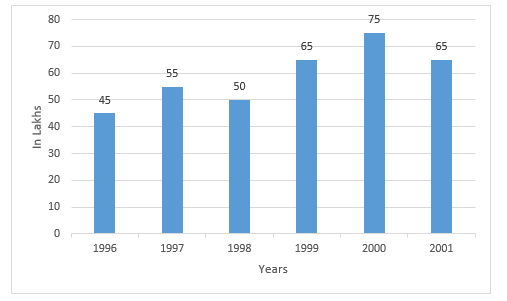
The following graph given the annual percent profit earned by a company during the period 1996-2001. Study the graph carefully and answer the question that follow. %$Profit=\frac{Income \, - \, Expenditure}{Expenditure}×100$
The expenditure of the company during the year 1996 was ₹30 crores. The income of the company in that year was (in crores ₹) : |
45 43.5 44.5 44 |
43.5 |
In year 1996 , Expenditure of company = Rs.30 crores Profit % = 45% We know , $Profit % =\frac{Income \, - \, Expenditure}{Expenditure}×100$ 45 = \(\frac{Income\; - \; 30 }{30 }\) × 100 1350 = (Income - 30)× 100 Income = 30 + 13.50 = 43.5
|