CUET Preparation Today
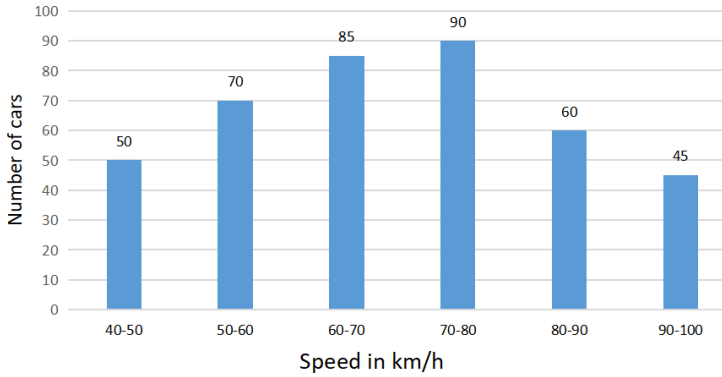
The given histogram shows the frequency distribution of the speed of cars passing through a particular spot on a highway. Read the graph and answer the following question.
What is the ratio of the number of cars with speed less than 60 km/h to the number of cars with speed more than 70 km/h? |
8 : 13 5 : 8 13 : 8 8 : 5 |
8 : 13 |