CUET Preparation Today
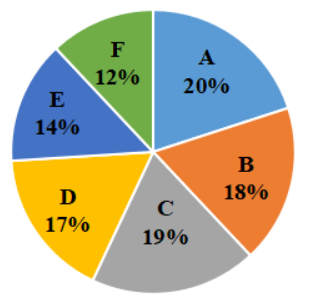
The following Pie chart represents the percentage-wise distribution of 800 students of class XII in a school in six different sections A, B, C, D, E and F.
The table given below shows the number of girls of class XII in six different sections A, B, C, D, E and F.
The total number of girls in sections B, C and D together is what percent more than the total number of boys in sections A, B and D together? |
50 76.25 65.75 80 |
76.25 |
20% = \(\frac{1}{5}\) Total number of boys in A , B & D = (\(\frac{1}{5}\) × 800 - 102 ) + ( \(\frac{18}{100}\) × 800 - 80 ) + ( \(\frac{17}{100}\) × 800 - 98 ) = 58 + 64 + 38 = 160 Total number of girls in B , C & D = 80 + 104 + 98 = 282 Required percentage = \(\frac{282 - 160}{160}\) × 100 = \(\frac{122}{160}\) × 100 = 76.25% |