What does population pyramid show?
Answer & explanation
Correct answer: option 4
The correct answer is Option (4) → Age, gender, growth
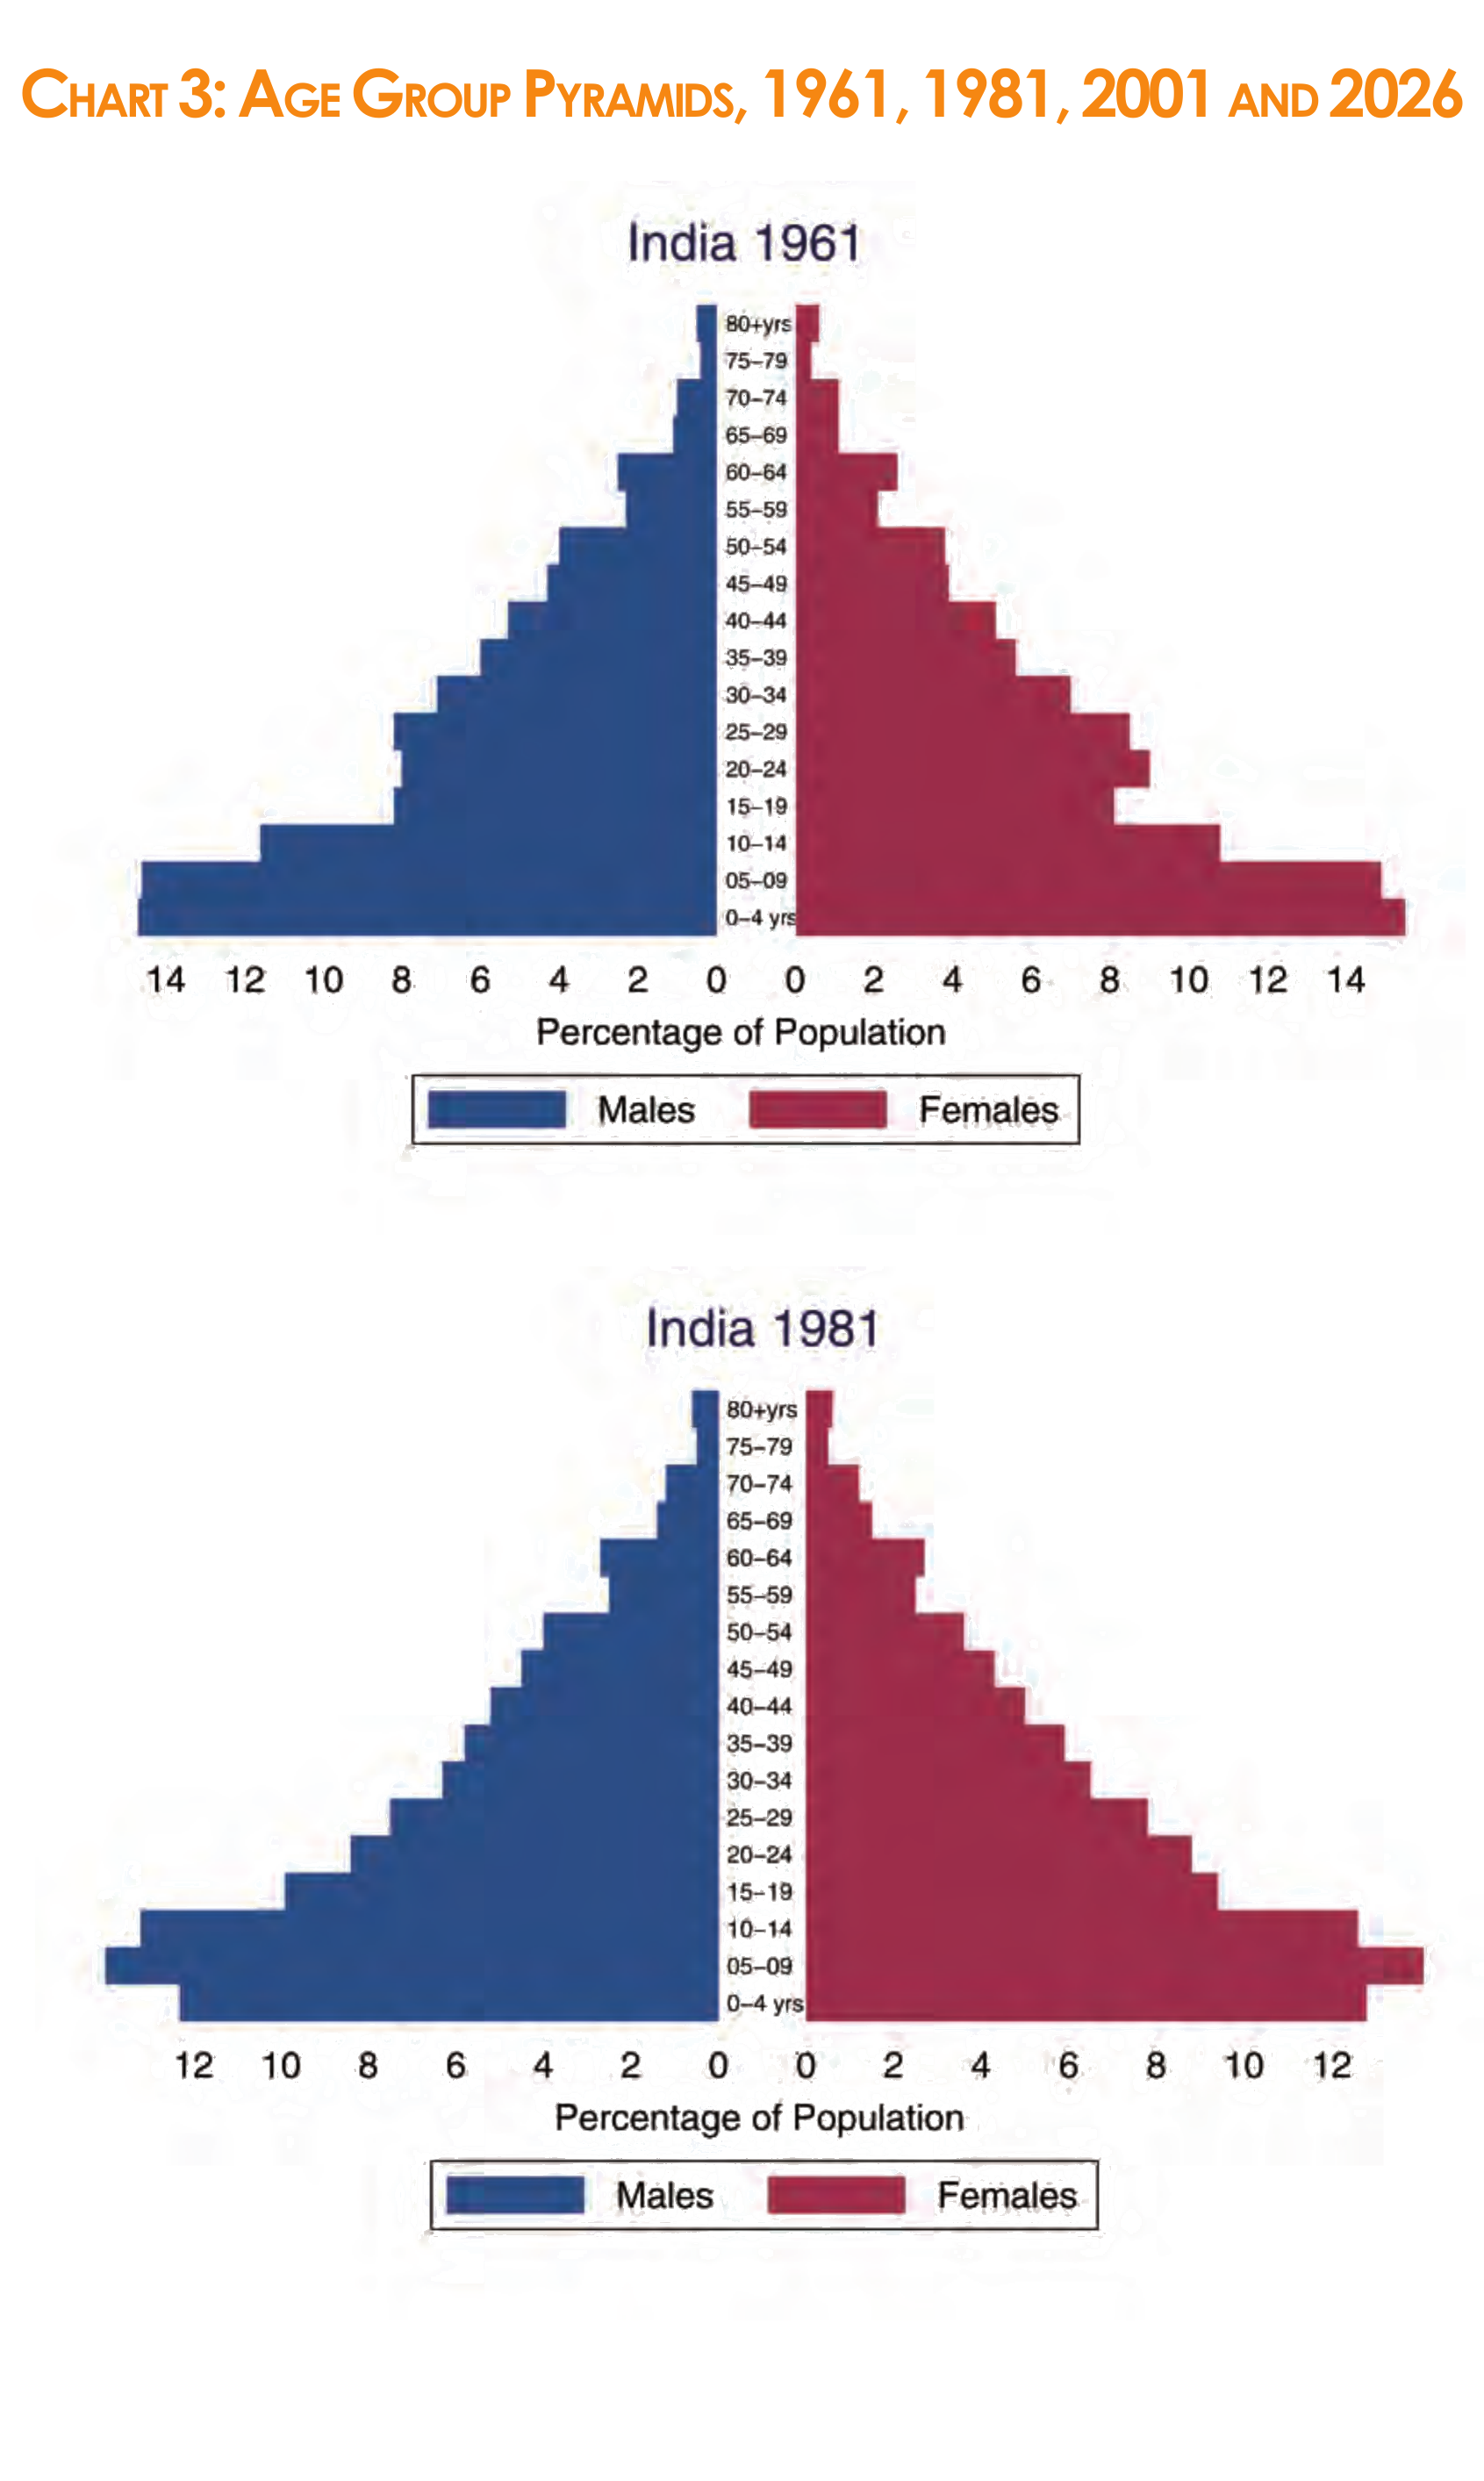
Option (4) Age, gender, growth — Correct. A population pyramid shows the population by five-year age groups, from 0–4 years at the bottom to 80 years and above at the top, with males on the left side and females on the right. Pyramids for different years, 1961 to the projection for 2026, show how the population and each age group grow and change in shape over time.
NCERT (2025-26): “Exercise for Chart 3 … The Age Group ‘pyramid’ shown in Chart 3 provides a much more detailed version of the kind of age grouped data presented in Table 2. Here, data are shown separately for males (on the left side) and females (on the right side) with the relevant five-year age group in the middle. Looking at the horizontal bars (including both males and females in a particular age group) gives you a visual sense of the age structure of the population. The age groups begin from the 0-4 years group at the bottom of the pyramid and go on to the 80 years and above age group at the top. There are four different pyramids for the decennial census years of 1961, 1981, 2001 and the estimates for 2026. The pyramid for 2026 shows the estimated future size of the relevant age groups based on data on the past rates of growth of each age group. Such estimates are also called ‘projections’. These pyramids show you the effect of a gradual fall in the birth rate and rise in the life expectancy. As more and more people begin to live to an older age, the top of the pyramid grows wider. As relatively fewer new births take place, the bottom of the pyramid grows narrower. But the birth rate is slow to fall, so the bottom doesn’t change much between 1961 and 1981. The middle of the pyramid grows wider and wider as its share of the total population increases. This creates a ‘bulge’ in the middle age groups that is clearly visible in the pyramid for 2026. This is what is refered to as the ‘demographic dividend’ which will be discussed later in this chapter.…”
Chart 3: Age Group Pyramids - the 1961 and 1981 pyramids (NCERT 2025-26) |