CUET Preparation Today
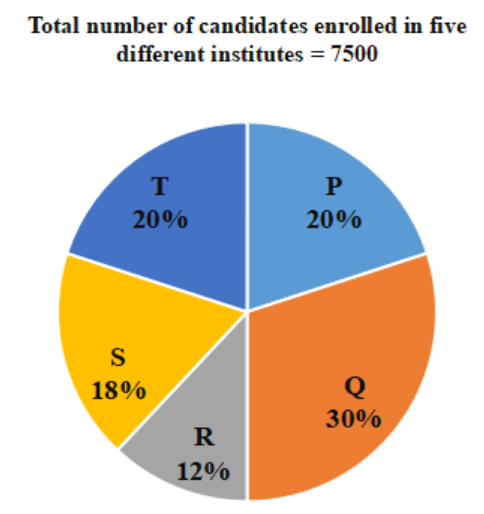
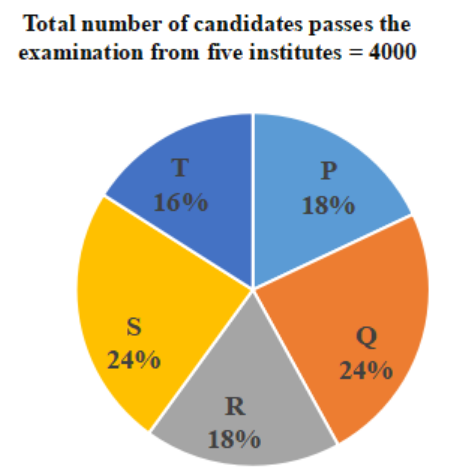
The following pie charts represent the distribution of candidates who were enrolled for a competitive examination, and the candidates (out of those enrolled) who passed the exam from five different institutes P, Q, R, S and T.
What is the ratio of the total number of candidates enrolled in institutes Q, R and S together, to the number of candidates passed from the institutes Q, R and S together? |
44 : 75 71 : 15 15 : 71 75 : 44 |
75 : 44 |
Number of candidates enrolled in institutes Q, R and S : Number of candidates passed from the institutes Q, R and S ( 30% +12% +18% ) of 7500 : ( 24% + 18% + 24%) of 4000 60% of 7500 : 66% of 4000 75 : 44 |