CUET Preparation Today
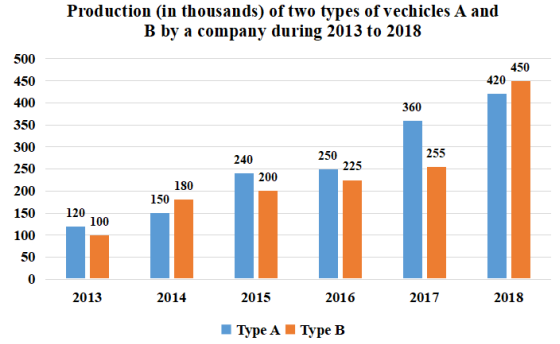
Study the given graph and answer the question that follows.
What is the ratio of the total number of vehicles of type A produced in 2015 and 2017 to the total number of vehicles of type B produced in 2016 and 2017? |
4 : 3 5 : 4 5 : 3 3 : 2 |
5 : 4 |
Total number of vehicles of type A produced in 2015 and 2017 : Total number of vehicles of type B produced in 2016 and 2017 ( 240 + 360 ) : ( 225 + 255 ) 600 : 480 5 : 4 |