CUET Preparation Today
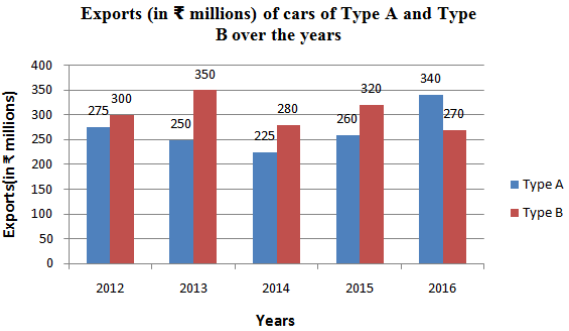
Study the graph and answer the question.
In which year, were the exports of type B cars exactly 20% more than the exports of type A cars in 2014? |
2015 2016 2012 2013 |
2016 |
Lets solve one by one for each option . 1. 2015 Percentage more of B comparative to A in 2014 = \(\frac{320 - 225}{225}\) × 100 = \(\frac{95}{225}\) × 100 = 42.22% 2. 2016 Percentage more of B comparative to A in 2014 = \(\frac{270 - 225}{225}\) × 100 = \(\frac{45}{225}\) × 100 = 20% 3. 2012 Percentage more of B comparative to A = \(\frac{300 - 275}{275}\) × 100 = \(\frac{25}{275}\) × 100 = 9.09% 4. 2013 Percentage more of B comparative to A = \(\frac{350 - 250}{250}\) × 100 = \(\frac{100}{250}\) × 100 = 23.07% Ans :- 2016 |