CUET Preparation Today
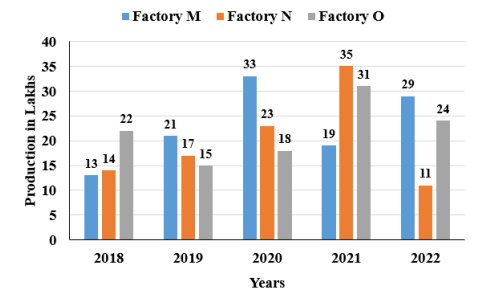
The following bar graph shows the production of pens (in lakhs) by three companies M, N, O from 2018 to 2022. What is the ratio of the average production of Company O in the period 2019-2021 to the average production of Company M in the same period ?
|
55 : 46 66 : 9 64 : 73 64 : 65 |
64 : 73 |
Average production of O in 2019 - 2021 : Average production of M in 2019 - 2021 \(\frac{15 + 18 + 31 }{3}\) : \(\frac{21 + 33 + 19 }{3}\) 64 : 73 |