Target Exam

CUET

Subject

Biology

Chapter

Organisms and Populations

Question:

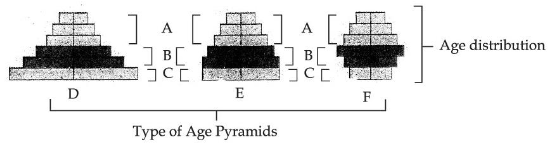
Observe the given figure representing different are pyramids for human population answer the following question.

Match List - I with List - II.

List – I

List – II

(A) Stable

(I) A

(B) Post reproductive stage

(II) F

(C) Declining

(III) D

(D) Expanding

(IV) E

Choose the correct answer from the options given below:

Options:

(A)-(I), (B)-(II), (C)-(III), (D)-(IV)

(A)-(IV), (B)-(II), (C)-(III), (D)-(I)

(A)-(IV), (B)-(I), (C)-(II), (D)-(III)

(A)-(II), (B)-(III), (C)-(I), (D)-(IV)

Correct Answer:

(A)-(IV), (B)-(I), (C)-(II), (D)-(III)

Explanation:

The correct answer is Option (3) → (A)-(IV), (B)-(I), (C)-(II), (D)-(III)

List – I

List – II

(A) Stable

(IV) E

(B) Post reproductive stage

(I) A

(C) Declining

(II) F

(D) Expanding

(III) D

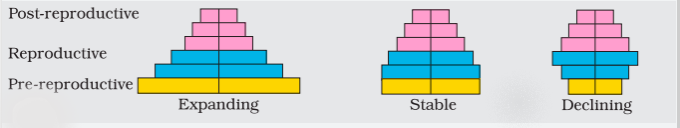
The shapes of age pyramids can be classified as follows:

  • Triangular-shaped age pyramids indicate a high number of pre-reproductive individuals, a moderate number of reproductive individuals, and even fewer post-reproductive individuals. This type of population is anticipated to grow or expand.
  • Bell-shaped age pyramids occur when pre-reproductive and reproductive individuals are nearly equal in numbers or percentages, with relatively fewer post-reproductive individuals. This population is expected to remain stable.
  • Urn-shaped age pyramids exhibit low numbers or percentages of pre-reproductive individuals, a maximum number of individuals in the reproductive age group, and a small number of individuals in the post-reproductive age group. Such a population is considered to decline.


                                   Representation of age pyramids for human population