
Which of the following is true for the Maxwell-Boltzmann distribution curve?
Answer & explanation
Correct answer: option 3
The correct answer is Option (3) → It is a plot of the fraction of molecules against kinetic energy
NCERT (2026-27 edition):
3.4 Temperature Dependence of the Rate of a Reaction – “All the molecules in the reacting species do not have the same kinetic energy. Since it is difficult to predict the behaviour of any one molecule with precision, Ludwig Boltzmann and James Clark Maxwell used statistics to predict the behaviour of large number of molecules. According to them, the distribution of kinetic energy may be described by plotting the fraction of molecules (NE/NT) with a given kinetic energy (E) vs kinetic energy (Fig. 3.8).”
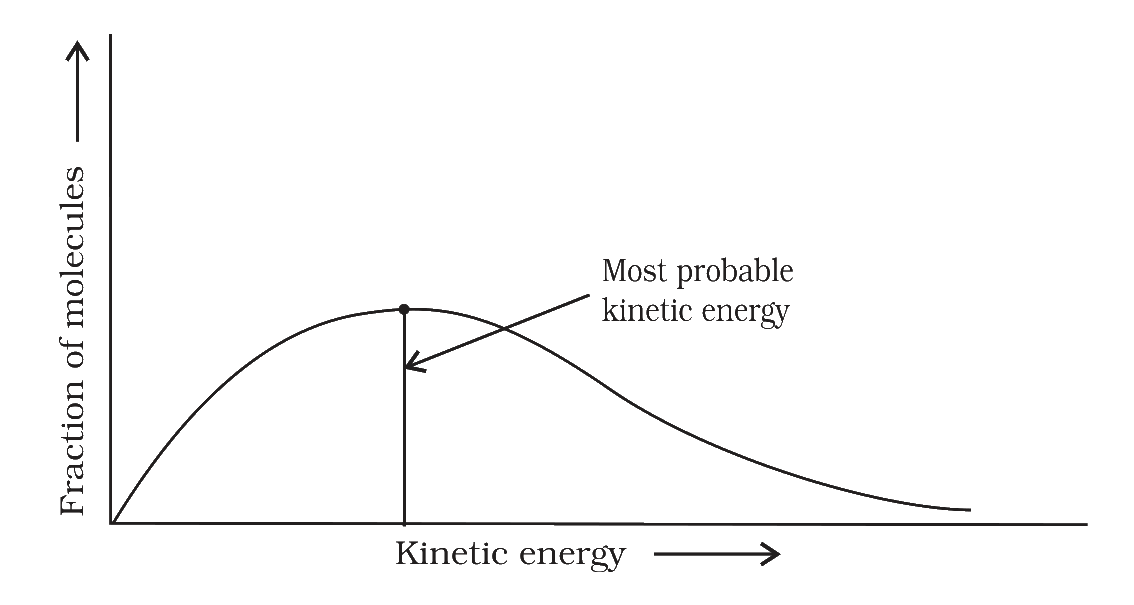
Fig. 3.8: Distribution curve showing energies among gaseous molecules