CUET Preparation Today
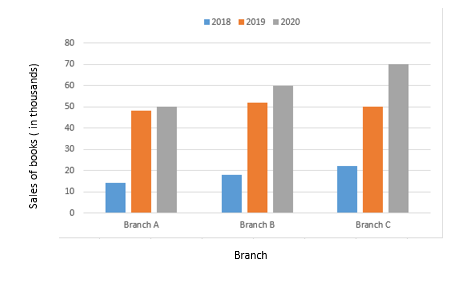
The following bar graph shows the sales of books (in thousands) from 3 branches of a company in three consecutive years 2018, 2019 and 2020. What is the ratio of the total sales of branch A for the year 2018 to the total sales of branch C for the year 2020 ?
|
1 : 1 5 : 1 4 : 3 1 : 5 |
1 : 5 |
Ratio of sale of branch A in 2018 to sale of branch C in 2020 , = 14 : 70 = 1 : 5 |