CUET Preparation Today
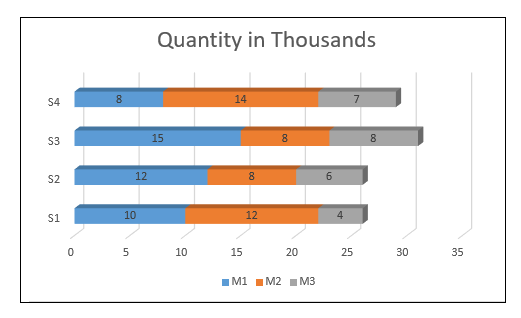
Study the given chart and answer the question that follows. The chart shows the quantities of machines (M1, M2, M3) available in different stores(S1, S2, S3, S4).
Which stores have more number of M2 machines than the average number of M2 machines per store ? |
S2 and S4 S1 and S3 S2 and S3 S1 and S4 |
S1 and S4 |
Average number of M2 machines = \(\frac{14 + 8 + 8 + 12 }{4}\) = \(\frac{42 }{4}\) = 10.5 Store S1 & Store S2 have more number of M2 machines than average . Ans :- S1 & S2 |