
Which of the following graph correctly shows the relation between photoelectric current (I) and wavelength \( (\lambda) \) of incident radiation
Answer & explanation
Correct answer: option 4
The correct answer is Option (4)
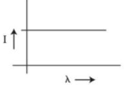
In the photoelectric effect, electrons are emitted only when the frequency of the radiation is above the threshold frequency, that is, when its wavelength is shorter than the threshold wavelength \( \lambda_0 \).
Above the threshold, each photon that is absorbed frees at most one electron, and the number of electrons emitted per second is set by the intensity of the radiation. Experiments show that for a given intensity the saturation photoelectric current is the same for all frequencies above the threshold; only the stopping potential (the maximum kinetic energy) changes with frequency.
\( \displaystyle I_{\mathrm{sat}} \propto \text{intensity}, \quad \text{independent of } \nu \text{ (and so of } \lambda = c/\nu) \)
So, for radiation of fixed intensity, the photoelectric current does not change as the wavelength is changed. The graph of \( I \) against \( \lambda \) is a horizontal straight line, which is graph (4).
NCERT (2026-27):
Effect of Frequency of Incident Radiation on Stopping Potential – “… We suitably adjust the same intensity of light radiation at various frequencies and study the variation of photocurrent with collector plate potential. The resulting variation is shown in Fig. 11.4. We obtain different values of stopping potential but the same value of the saturation current for incident radiation of different frequencies.”