
Read the following statements about the Punnett square:
A. The Punnett square was developed by a British geneticist, Reginald C. Punnett.
B. The Punnett square is a graphical representation to calculate the probability of all possible genotypes of offspring in a genetic cross.
C. In a Punnett square, the possible gametes are written on two sides, usually the top row and left columns.
D. In a monohybrid cross, the F1 plant of genotype Tt on self-pollination produces gametes of genotype T and t in the ratio 3 : 1.
How many of the above statements are correct?
Answer & explanation
Correct answer: option 3
The correct answer is Option (3) → Three
A Punnett square is a grid used to work out the offspring of a cross. The gametes of one parent are written along the top and those of the other parent down the left side. Each box gives one possible zygote.
A. The Punnett square was developed by a British geneticist, Reginald C. Punnett. — True. The diagram is named after the British geneticist Reginald C. Punnett, who developed it.
B. The Punnett square is a graphical representation to calculate the probability of all possible genotypes of offspring in a genetic cross. — True. It is a graphical way to find the probability of all possible genotypes of the offspring in a cross.
C. In a Punnett square, the possible gametes are written on two sides, usually the top row and left columns. — True. The possible gametes are written on two sides, usually the top row and the left column; their combinations fill the boxes.
D. In a monohybrid cross, the F1 plant of genotype Tt on self-pollination produces gametes of genotype T and t in the ratio 3 : 1. — False. A Tt plant gives T and t gametes in equal proportion (1 : 1), because the two alleles separate into different gametes. The 3 : 1 ratio is the F2 phenotypic ratio (tall : dwarf) that appears after these gametes combine:
| T | t | |
| T | TT (tall) | Tt (tall) |
| t | Tt (tall) | tt (dwarf) |
Statements A, B and C are correct, so three statements are correct.
NCERT Extract:
Inheritance of One Gene – “… The production of gametes by the parents, the formation of the zygotes, the F1 and F2 plants can be understood from a diagram called Punnett Square as shown in Figure 4.4. It was developed by a British geneticist, Reginald C. Punnett. It is a graphical representation to calculate the probability of all possible genotypes of offspring in a genetic cross. The possible gametes are written on two sides, usually the top row and left columns. All possible combinations are represented in boxes below in the squares, which generates a square output form. … The F1 plant of the genotype Tt when self-pollinated, produces gametes of the genotype T and t in equal proportion.”
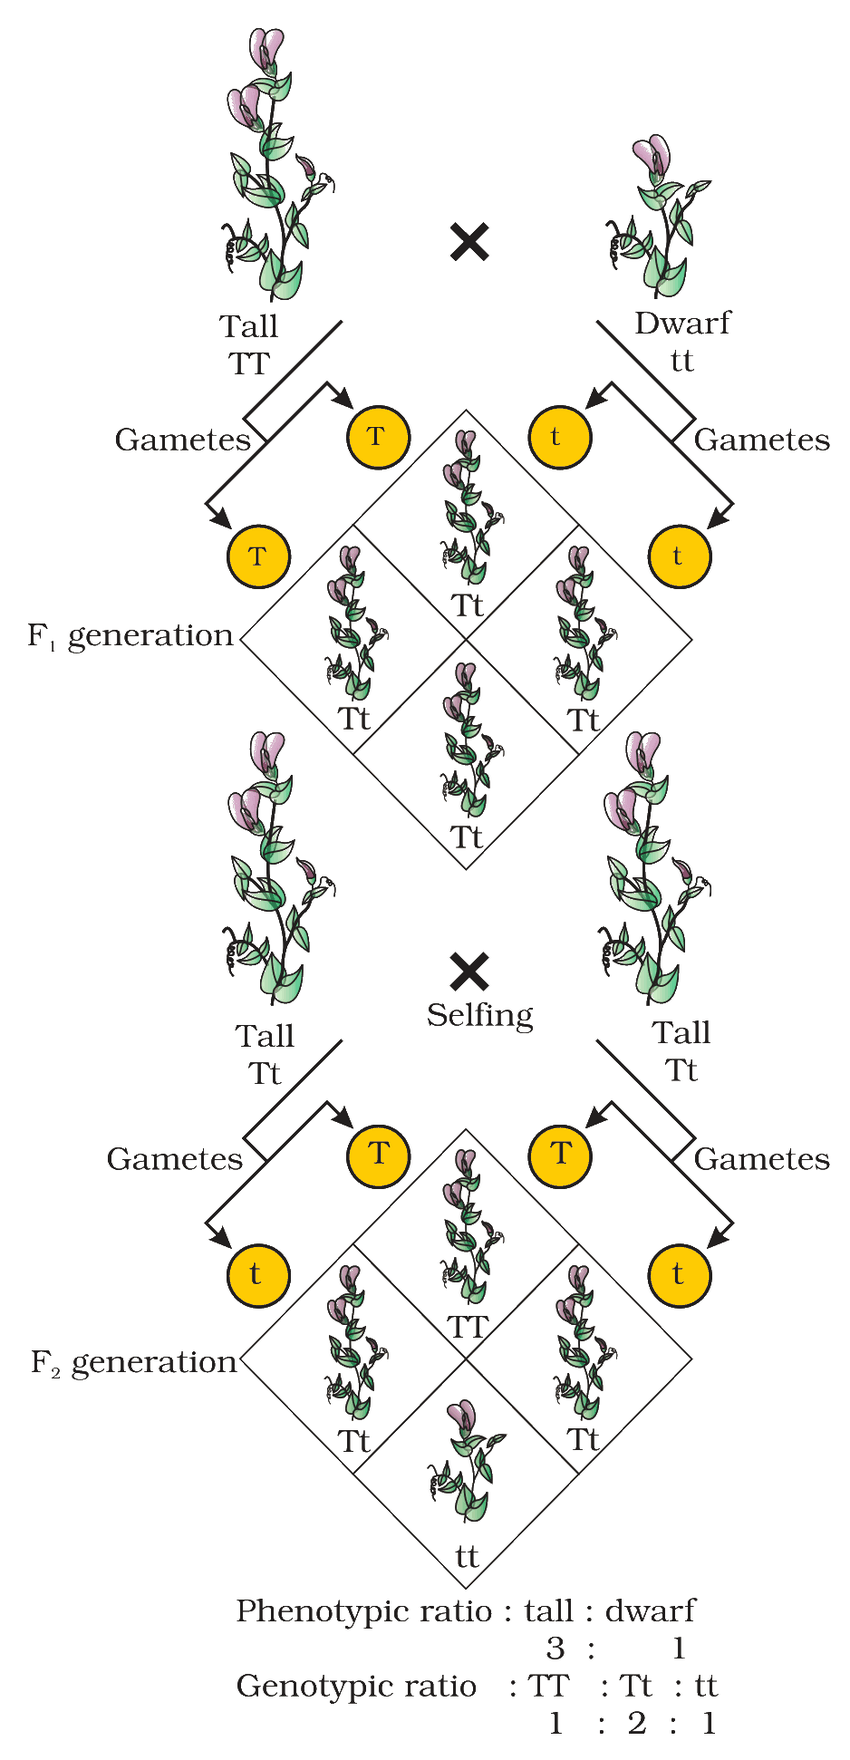
Figure 4.4 A Punnett square used to understand a typical monohybrid cross conducted by Mendel between true-breeding tall plants and true-breeding dwarf plants