CUET Preparation Today
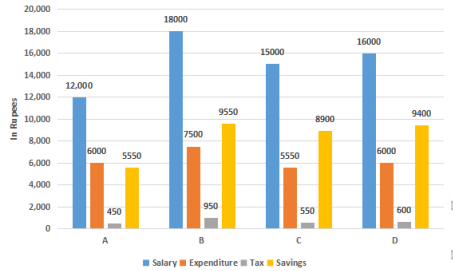
The above graph represents the salary, expenditure, tax and savings (in rupees) per month ofthe persons A, B, C and D. Study the graph and answer the question. Savings as a percentage of salary is highest in case of: |
B D C A |
C |
Lets solve one by one for each option. 1.B Tax as a percentage of salary = \(\frac{9550 }{18000}\) × 100 = 53.05% 2.D Tax as a percentage of salary = \(\frac{9400 }{16000}\) × 100 = 58.75% 3. C Tax as a percentage of salary = \(\frac{8900 }{15000}\) × 100 = 59.33% 4. A Tax as a percentage of salary = \(\frac{5550 }{12000}\) × 100 = 46.25% So , Tax as a percentage of salary is least for C. Ans :- C |