CUET Preparation Today
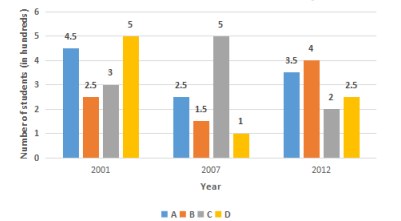
The following bar graph shows the number of students (in hundreds) who have opted for different courses A, B, C and D in 3 years in a college. Study the graph and answer the question.
In the year 2007, the average number of students across the four courses is (in hundreds): |
2.7 1.5 2.2 2.5 |
2.5 |
Total number of students in 2007 = 2.5 + 1.5 + 5 + 1 = 10 Average number of students in 2007 = \(\frac{10 }{4}\) = 2.5 |