CUET Preparation Today
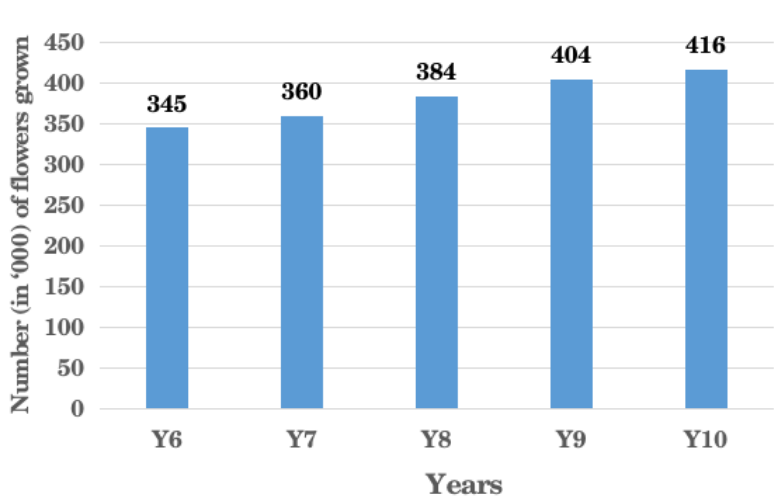
The following bar chart shows the number of flowers (in '000 kg) grown by a floriculturist in 5 consecutive years?
The number of flowers grown in Y5 was 15% more than those grown in Y4. The number of flowers grown in Y6 was 20% more than those grown in Y5. What is the difference between the numbers of flowers grown in Y9 and Y4? |
168000 142000 154000 132000 |
154000 |
15% = \(\frac{3 }{20}\) & 20% = \(\frac{1 }{5}\) Ratio of , Y4 : Y5 = 20 : 23 & Y5 : Y6 = 5 : 6 Overall , Y4 : Y5 : Y6 = 100 : 115 : 138 ATQ , 138R = 345000 1R = 2500 Y4 = 100R = 250000 and Y9 = 404000 Difference in Y4 & Y9 = 404000 - 250000 = 154000 |