CUET Preparation Today
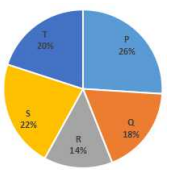
The following pie-chart shows the percentage-wise distribution of the number of students in five different schools P, Q, R, S and T. Total number of students in all five schools together is 8400.
The number of students in school T is what percentage of the total number of students in schools Q and S together. |
45% 50% 40% 55% |
50% |
Number of students in T = 20% Number of students in Q and S = 18% + 22% = 40% Required percentage = \(\frac{20 }{40}\) × 100 = 50% |