CUET Preparation Today
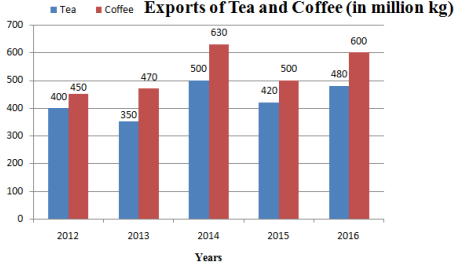
The given Bar Graph presents the Export of Tea and Coffee (in million kg) for the years 2012 to 2016.
The number of years, in each of which the export of coffee is more than 20% as compared to the export of tea in that year is: |
2 3 4 1 |
3 |
In 2012 , Percentage of export of coffee more than tea = \(\frac{450-400 }{400}\) × 100 = 12.5% In 2013 , Percentage of export of coffee more than tea = \(\frac{470-350 }{350}\) × 100 = 34.28% In 2014, Percentage of export of coffee more than tea = \(\frac{630-500 }{500}\) × 100 = 26% In 2015 , Percentage of export of coffee more than tea = \(\frac{500-420 }{420}\) × 100 = 19.04% In 2016 , Percentage of export of coffee more than tea = \(\frac{600-480 }{480}\) × 100 = 25% In year 2013 , 2014 & 2016 required percentage is more than 20%. Ans :- 3
|