CUET Preparation Today
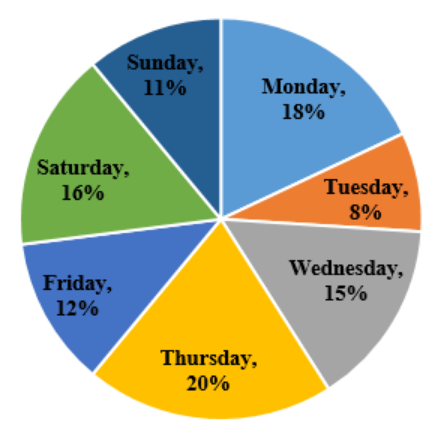
The given pie chart represents the percentage distribution of the number of sandwiches sold by a shopkeeper on different days of a week.
The total number of sandwiches sold on Tuesday is what percentage of the total number of sandwiches sold on Saturday? |
40% 60% 45% 50% |
50% |
Number of sandwiches sold on Tuesday = 8% Number of sandwiches sold on Saturday= 16% Required percentage = \(\frac{8}{16}\) × 100 = \(\frac{1}{2}\) × 100 = 50% |