CUET Preparation Today
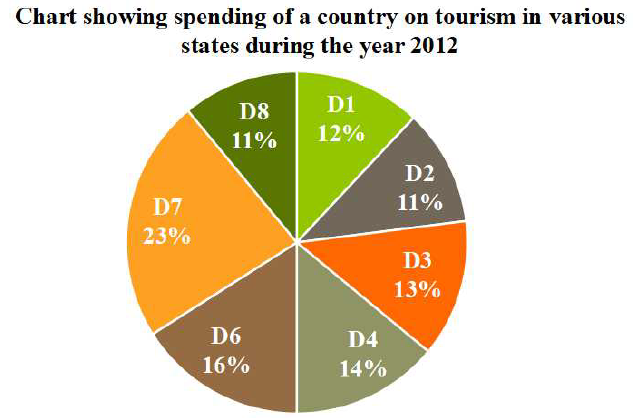
The following pie chart shows the spending of a country on tourism in various states during the year 2012 . Total spending of the country = ₹ 49,62,000
The amount spent on state together D1 and D4 exceeds that spent on together D2 and D8 by: |
₹ 1,89,760 ₹ 1,97,890 ₹ 1,98,480 ₹ 1,78,960 |
₹ 1,98,480 |
Difference in amount spend on D1 and D4 to amount spend on D2 and D8 = (12%+14%) of 49,62,000 - (11%+11%) of 49,62,000 = \(\frac{1}{25}\) × 49,62,000 = 198480 |