CUET Preparation Today
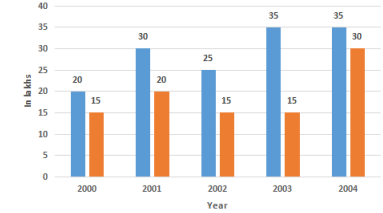
In the given bar graph, the white bar shows the income and the black bar shows the expenditure of a company. Study the graph and answer the question that follows.
The expenditure from 2001 to 2002 decreased by |
$33\frac{1}{3}$% $35\frac{1}{3}$% $36\frac{1}{3}$% $34\frac{1}{3}$% |
$33\frac{1}{3}$% |
Expenditure in 2001 = 20 Expenditure in 2002 = 15 Required percentage = \(\frac{20-15 }{15}\) × 100 = \(\frac{5 }{15}\) × 100 = 33\(\frac{1 }{3}\)% |