CUET Preparation Today
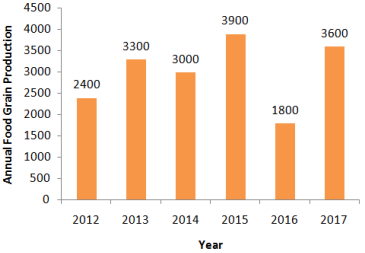
The bar chart shows the annual food grain production (in million tonnes) for years 2012-2017. For how many years is the production less than the average production during the given period?
|
1 3 2 4 |
2 |
Average production = \(\frac{2400+3300+3000+3900+1800+3600 }{6}\) = \(\frac{ 18000 }{6}\) = 3000 So , In year 2012 & 2016 production is less than average production. Ans :- 2 |