CUET Preparation Today
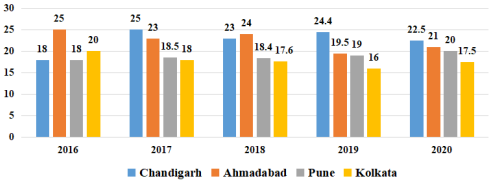
The given graph shows the number(in hundreds) of trees axed in four cities during the period 2016-2020.
Find the year in which the least number of trees are axed. |
2016 2020 2019 2017 |
2019 |
Number of trees axed in 2016 = 18 + 25 + 18 + 20 = 81 Number of trees axed in 2017 = 25 + 23 + 18.5 + 18 = 84.5 Number of trees axed in 2018 = 23 + 24 + 18.4 + 17.6 = 83 Number of trees axed in 2019 = 24.4 + 19.5 + 19 + 16 = 78.9 Number of trees axed in 2020 = 25.5 + 21 + 20 + 17.5 = 84 Minimum trees axed in 2019. |