
CUETMOCK
  • Pricing
  • Mentors
Log inStart freeStart free mocks→

First test, then trust

Try a free CUET mock test.

Join 5,00,000+ students who rehearsed exam day on the exact NTA screen before sitting CUET. On the web and on Android.

Start free mocks →Get the Android app
CUETMOCK

India's #1 CUET Mock Test Platform. Original NCERT-based questions on the exact NTA exam screen — trusted by 5,00,000+ students since CUET 2022.

Get it onGoogle PlayScan to download the CUETMOCK app

Mock tests

  • CUET mock test series
  • Browse all papers
  • Commerce mocks
  • Humanities (Arts) mocks
  • Science mocks
  • Languages & GAT mocks
  • Free practice questions
  • Pricing

Resources

  • CUET exam guide
  • CUET syllabus
  • Universities accepting CUET
  • Expert blogs
  • News & notifications
  • Webinars & counselling
  • CUET score calculator
  • How we estimate your rank
  • FAQs

Company

  • About us
  • Our leadership & team
  • Our toppers
  • Mentors
  • For schools
  • Contact us
  • Terms
  • Privacy
  • Refund policy

Talk to us

+91 7696 6630 56info@cuetmock.comWhatsApp us

Our other platforms

  • JEE Mock — For IIT-JEE aspirants
  • NEET Mock — For NEET aspirants

Newsletter

Exam updates, study material and offers — no spam.

© 2026 NYC Ventures Pvt. Ltd.

701-702, Royal Business Park, Zirakpur, Punjab - 140603

  • Terms of use
  • Privacy policy
  • Refund policy
  • Contact us

iCUETMOCK is an independent preparation platform, not affiliated with the National Testing Agency (NTA). Always check exam details on the official NTA website.

  • Home
  • Mock tests
  • CUET guide
  • Pricing
  • Log in
Home/Practice questions/General Aptitude Test
General Aptitude TestQuantitative ReasoningData Interpretation & Stats

The given pie charts represent the popularity of ice-cream flavours i…

The given pie charts represent the popularity of ice-cream flavours in the years 2005 and 2015.
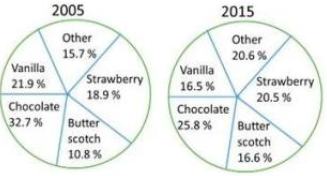
If a percentage point shift results in annual additional sales of 10,000, how much (in ₹), did the combined annual strawberry and butterscotch sales increase from 2005 to 2015?

Answer & explanation+

Correct answer: option 1

Total sale of strawberry and butterscotch in 2005 = 18.9% + 10.80% = 29.70%

Total sale of strawberry and butterscotch in 2015 = 20.50% + 16.60% = 37.10%

ATQ , Increase in sale ,

37.10% - 29.70% = 7.4%

Now , 7.4% × 10000 = 74000

Advertisement

Practise more on Quantitative Reasoning

Chapter-wise mocks on the real NTA exam screen, with solutions and your rank. Your first mocks are free.

Start free mocks →

Advertisement

Next questions

  1. The upper half of an inclined plane of inclination θ is perfectly smooth while lower half is rough. A block starting from rest at the top o…Physics · Work Power Energy
  2. Which exchange rate system is a mixture of a flexible exchange rate system and a fixed rate system?Economics · Macro Economics: Open Economy Macro Economics
  3. A radioactive isotope has half-life of ‘K’ years. How long will it take, so that activity reduces to 6.25% of its original value?Physics · Nuclei
  4. If x2 + 9y2 − 6xy = 0, then x : y is equal to:General Aptitude Test · Quantitative Reasoning
  5. Fill in the blank with the correct phrasal verb from the options given below:-Do not _____your children in front of their friends.English · Grammar: Phrasal Verb
  6. Select the option that is related to the third letter-cluster in the same way as the second letter-cluster is related to the first letter-c…General Aptitude Test · General Ability
  7. Read the following statements and find out the incorrect statement.Biology · Morphology of Flowering Plants
  8. Many commodities have a retail price and a wholesale price. These two prices may differ because of:Economics · Macro Economics: National Income Accounting
  9. Select the most appropriate meaning of the given idiom. To blow one's own trumpetEnglish · Grammar: Idioms
  10. The absolute maximum value of f(x) = x + 2cos x on the interval [0, π] isMaths. Section A · Applications of Derivatives (Section A)