CUET Preparation Today
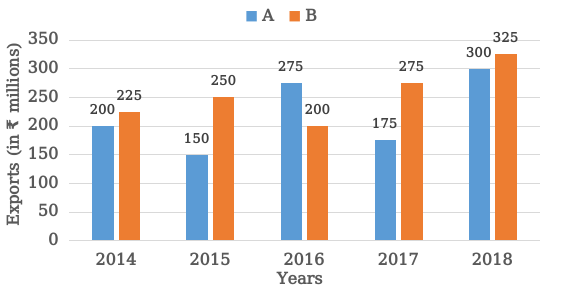
The given bar graph shows exports of cars of type A and B ( in ₹ millions) from 2014 to 2018. Study the graph and answer the question that follows. Exports of Cars of Type A and B ( in ₹ millions) during 2014 to 2018.
In which year are the exports of cars of type A ₹20 million more than the average exports (per year) of cars of type B ?
|
2015 2014 2016 2017 |
2016 |
Average export of car of type B over all years = \(\frac{225 + 250 + 200 + 275 + 325}{5}\) = \(\frac{1275}{5}\) = 255 20 million more than 225 million = 255 + 20 = 275 million Export of car A in years 2016 is 275 million. |