CUET Preparation Today
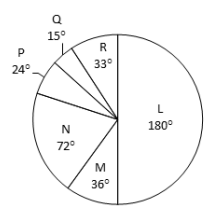
The pie chart given below shows the number of trucks manufactured by Six companies in a year. Total trucks manufactured by all these Six companies are 2160. Number of trucks manufactured by a particular company is shown in terms of degree with respect to the total number of trucks manufactured by all these Six companies.
Total number of trucks manufactured by L, N and Q is how much percent more than the total number of trucks manufactured by M and R? |
286.95% 274.56% 188.24% 192.85% |
286.95% |
Share of L, N, Q in terms of degrees = 180° + 72° + 15° = 267° Total number of trucks manufactured by L, N and Q = $\frac{267°}{360°}$ x 2160 Share of M, R in terms of degrees = 36° + 33° = 69° Total number of trucks manufactured by L, N and Q = $\frac{69°}{360°}$ x 2160 Total number of trucks manufactured by L, N and Q is more than the total number of trucks manufactured by M and R by $\frac{198}{69}$ x 100 = 286.95%
|