
CUETMOCK
  • Pricing
  • Mentors
Log inStart freeStart free mocks→

First test, then trust

Try a free CUET mock test.

Join 5,00,000+ students who rehearsed exam day on the exact NTA screen before sitting CUET. On the web and on Android.

Start free mocks →Get the Android app
CUETMOCK

India's #1 CUET Mock Test Platform. Original NCERT-based questions on the exact NTA exam screen — trusted by 5,00,000+ students since CUET 2022.

Get it onGoogle PlayScan to download the CUETMOCK app

Mock tests

  • CUET mock test series
  • Commerce mocks
  • Humanities (Arts) mocks
  • Science mocks
  • Languages & GAT mocks
  • Free practice questions
  • Pricing

Resources

  • CUET exam guide
  • CUET syllabus
  • Universities accepting CUET
  • Expert blogs
  • News & notifications
  • Webinars & counselling
  • CUET score calculator
  • How we estimate your rank
  • FAQs

Company

  • About us
  • Our leadership & team
  • Our toppers
  • Mentors
  • For schools
  • Contact us
  • Terms
  • Privacy
  • Refund policy

Talk to us

+91 7696 6630 56info@cuetmock.comWhatsApp us

Our other platforms

  • JEE Mock — For IIT-JEE aspirants
  • NEET Mock — For NEET aspirants

Newsletter

Exam updates, study material and offers — no spam.

© 2026 NYC Ventures Pvt. Ltd.

701-702, Royal Business Park, Zirakpur, Punjab - 140603

  • Terms of use
  • Privacy policy
  • Refund policy
  • Contact us

iCUETMOCK is an independent preparation platform, not affiliated with the National Testing Agency (NTA). Always check exam details on the official NTA website.

  • Home
  • Mock tests
  • CUET guide
  • Pricing
  • Log in
Home/Practice questions/Biology
BiologyBiodiversity and Conservation

What shape best describes the relationship between species richness a…

What shape best describes the relationship between species richness and area for a wide range of taxa?

Answer & explanation+

Correct answer: option 3

The correct answer is Option (3) → Rectangular hyperbola

Alexander von Humboldt saw that, within a region, species richness rises with the area explored, but only up to a limit. For many taxa, such as flowering plants, birds, bats and freshwater fishes, a plot of species richness against area gives a rectangular hyperbola: it rises steeply and then levels off.

Option (1) Straight line — Incorrect. The relationship becomes a straight line only when both axes are on a logarithmic scale (log S = log C + Z log A). On an ordinary graph the curve is not straight.

Option (2) Sigmoid curve — Incorrect. A sigmoid (S-shaped) curve describes logistic population growth, where numbers level off at the carrying capacity. It is not the species-area curve.

Option (3) Rectangular hyperbola — Correct. The species-area curve is a rectangular hyperbola, S = CAZ, for a wide variety of taxa.
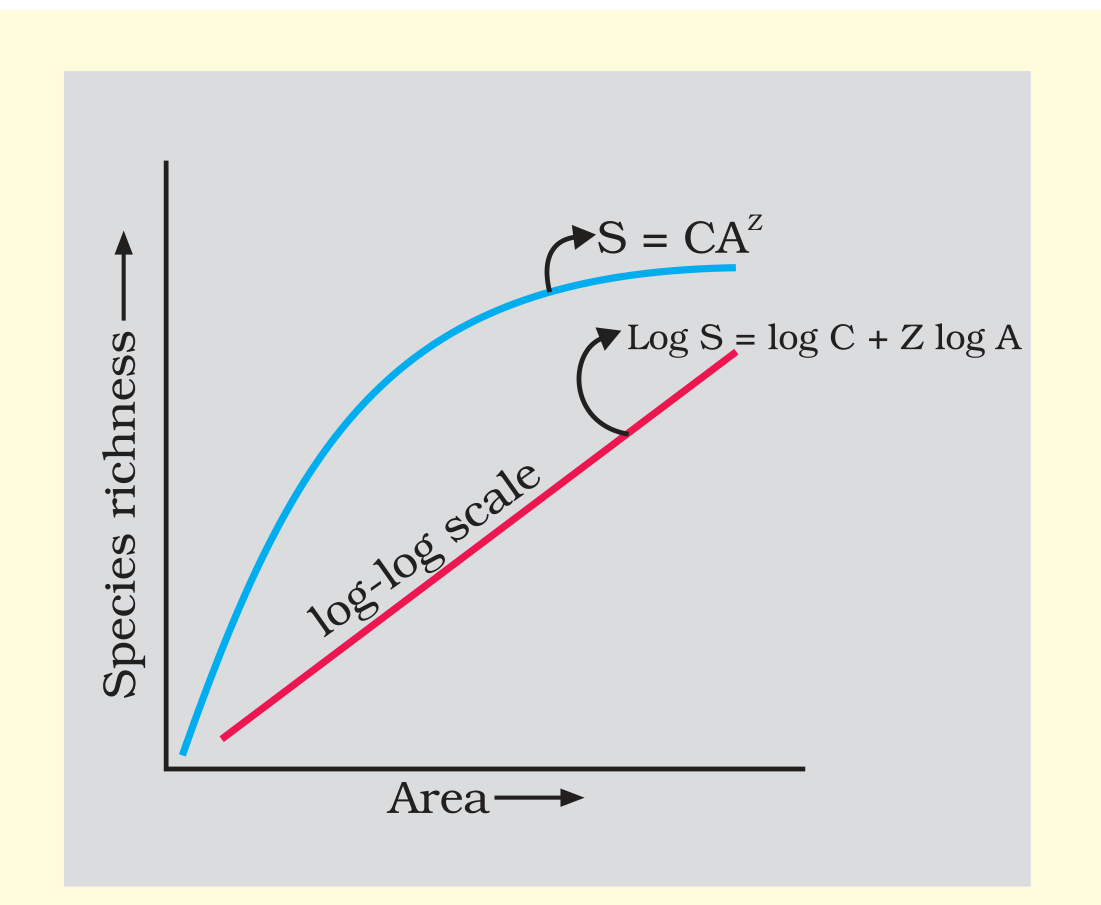
Textbook figure

Figure 13.2 Showing species area relationship. Note that on log scale the relationship becomes linear

NCERT Extract:
Patterns of Biodiversity – “… Species-Area relationships : During his pioneering and extensive explorations in the wilderness of South American jungles, the great German naturalist and geographer Alexander von Humboldt observed that within a region species richness increased with increasing explored area, but only up to a limit. In fact, the relation between species richness and area for a wide variety of taxa (angiosperm plants, birds, bats, freshwater fishes) turns out to be a rectangular hyperbola (Figure 13.2).”
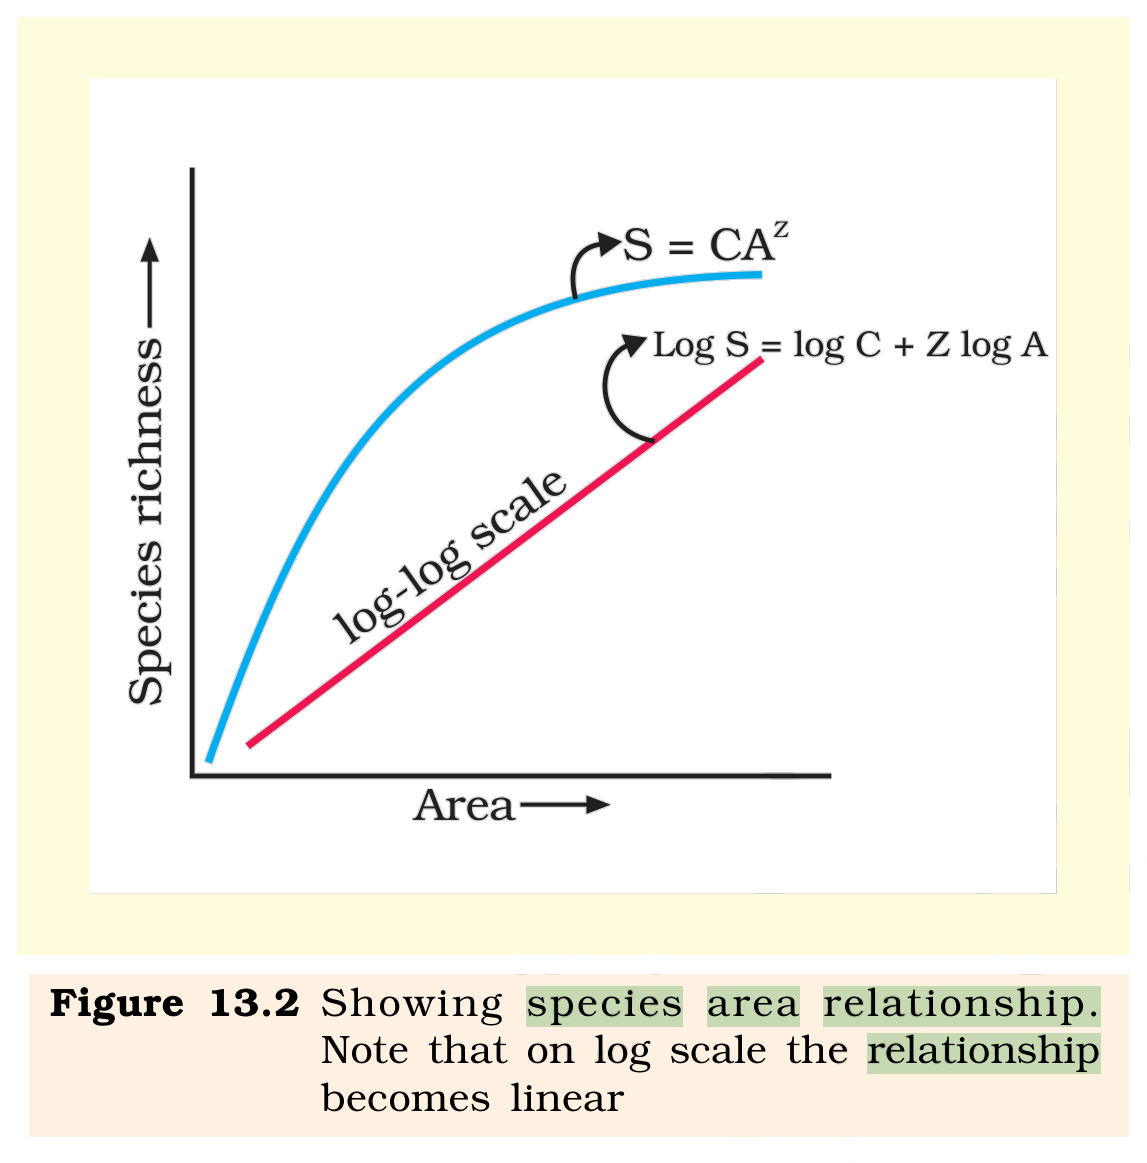
NCERT Figure 13.2

Advertisement

Practise more on Biodiversity and Conservation

Chapter-wise mocks on the real NTA exam screen, with solutions and your rank. Your first mocks are free.

Start free mocks →

Advertisement

Next questions

  1. Diwali has been declared as a holiday from 2023 in the public schools of which of the city?General Aptitude Test · Current Affairs
  2. Which of the following falls under wasteland?Geography · India-People and Economy: Land resources and Agriculture
  3. Choose a statement which can be a valid critique of Malthusian Theory.Sociology · Indian Society: Demographic Structure of Indian Society
  4. Match List-I with List-IIList-IList-IIPollutionSources of pollution(A)Air pollution(I)Urban run-off(B)Water pollution(II)Advertising media(…Geography · India-People and Economy: Geographical Perspective on selected issues and Problems
  5. 'पतितपावन' शब्द में कौन-सा समास है?Hindi · व्याकरण - ससमास
  6. A and B can finish a piece of work in 18 days and 27 days respectively. Together they start the work but after few days B left the job. Aft…General Aptitude Test · Numerical Ability
  7. World's largest field hockey stadium based on the seating capacity is located in which country?General Aptitude Test · General Knowledge
  8. From the options given below, select the word which means the same as – ‘Tie’English · Synonyms
  9. Select the correct Active/Passive form of the given sentence. Jonathan said to Sam, “It’s 10 O’clock by my watch.”English · Grammar: Active Passive Voice
  10. Development of irrigation has resulted in moderate to high concentration of population in which of the following states?Geography · India-People and Economy: Population-Distribution,Density, Growth and Composition