
Based on the following given information answer the question
Consider the function \(f(x) = x|x|\), \(x \in \mathrm{R}\).
The region bounded by curve \(y = x|x|\), x-axis and lines \(x = \pm 1\) is best represented graphically by :
Answer & explanation
Correct answer: option 3
The correct answer is Option (3) →
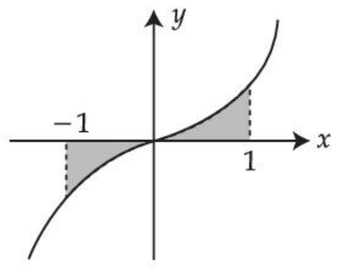
Removing the modulus:
\( f(x) = \begin{cases} x^{2}, & x \ge 0 \\ -x^{2}, & x \lt 0 \end{cases} \)
So for x > 0 the curve is the right half of the upward parabola \(y = x^{2}\), lying above the x-axis, and for x < 0 it is the left half of \(y = -x^{2}\), lying below the x-axis. Also f(−x) = −f(x), so the graph is symmetric about the origin.
The region between x = −1 and x = 1 is therefore shaded above the x-axis on the right of the y-axis and below it on the left, rising from left to right through the origin. Option (3) shades exactly this region.
Why the other options are incorrect
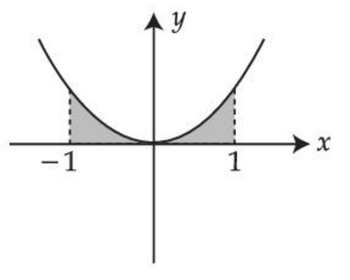
Option (1) — Incorrect. It shows \(y = x^{2}\), shaded above the x-axis on both sides, but for x < 0 the curve \(y = x|x|\) is below the x-axis (f(−1) = −1).
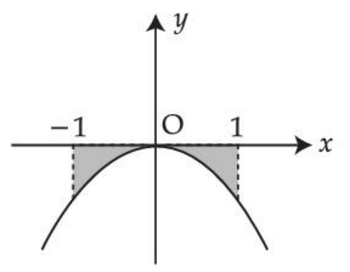
Option (2) — Incorrect. It shows \(y = -x^{2}\), shaded below the x-axis on both sides, but for x > 0 the curve is above the x-axis (f(1) = 1).
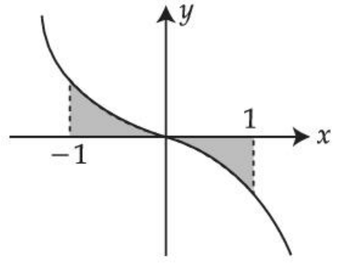
Option (4) — Incorrect. Its curve falls from left to right, above the x-axis on the left and below it on the right; that is \(y = -x|x|\), the opposite of f.