CUET Preparation Today
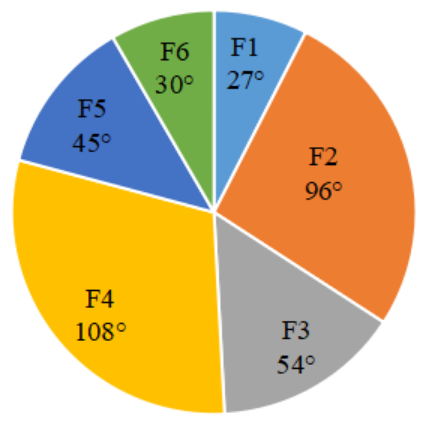
The following pie chart shows the sectors representing the shares of the number of lights manufactured in a given year by each of six different factories in terms of the central angles (in degrees) with respect to the total number of lights manufactured in that year by all the six factories taken together.
If the total number of lights manufactured in that year by the 6 factories taken together is 1840, then what is the difference between the numbers of lights manufactured by F5 and F1 ? |
96 94 90 92 |
92 |
Total number of lights manufactured in 6 years = 1840 Difference between the numbers of lights manufactured by F5 and F1 = \(\frac{45-27 }{360}\) × 1840 = \(\frac{ 18 }{360}\) × 1840 = 92 |