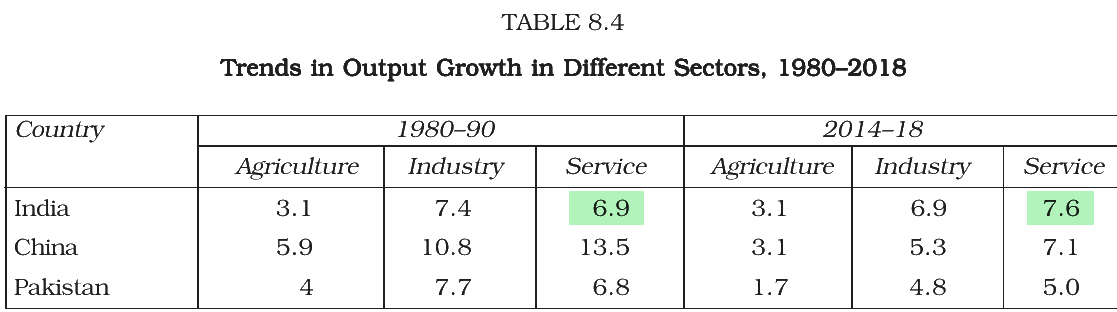
Study the table on trends in output growth (per cent) in different sectors:
| Country | Agriculture 1980-90 | Industry 1980-90 | Service 1980-90 | Agriculture 2014-18 | Industry 2014-18 | Service 2014-18 |
|---|---|---|---|---|---|---|
| India | 3.1 | 7.4 | 6.9 | 3.1 | 6.9 | 7.6 |
| China | 5.9 | 10.8 | 13.5 | 3.1 | 5.3 | 7.1 |
| Pakistan | 4.0 | 7.7 | 6.8 | 1.7 | 4.8 | 5.0 |
Which of the following statements is correct?
Answer & explanation
Correct answer: option 2
The correct answer is Option (2) → India’s service sector growth rate rose between 1980-90 and 2014-18.
Read each claim off the table.
Option (1) India’s industrial growth rate rose between 1980-90 and 2014-18. — Incorrect. It fell, from 7.4 to 6.9.
Option (2) India’s service sector growth rate rose between 1980-90 and 2014-18. — Correct. It rose from 6.9 to 7.6.
Option (3) In 2014-18, Pakistan’s agriculture grew faster than India’s. — Incorrect. Pakistan’s 1.7 is below India’s 3.1.
Option (4) In 1980-90, China’s industry grew faster than its service sector. — Incorrect. Industry grew at 10.8, below services at 13.5.
NCERT (2026-27): “… In case of service sector, China was able to maintain its rate of growth during 1980–1990,while there was a positive and increasing growth of India’s service sector output. Thus, China’s growth is contributed by the manufacturing and service sectors and India’s growth by the service sector. …” |